
Report No: NCP-RP-2008-004 Rev B
Report Date: October 20, 2023
CYTEC
(Formerly Advanced Composites Group)
MTM45-1/ 12K AS4 145gsm 32%RW
Unidirectional
Qualification Statistical Analysis Report
FAA Special Project Number SP3505WI-Q
NCAMP Report No: NCP-RP-2008-004 Rev B
Report Date: October 20, 2023
Elizabeth Clarkson, Ph.D.
National Center for Advanced Materials Performance (NCAMP)
National Institute for Aviation Research
Wichita State University
Wichita, KS 67260-0093
Testing Facility:
Advanced Composites Group National Institute for Aviation Research
5350 E. 129
th
E. Ave. Wichita State University
Tulsa, OK 74134 1845 N. Fairmount
Wichita, KS 67260
Test Panel Fabrication Facility:
Advanced Composites Group Solvay
5350 E. 129
th
E. Ave. 1440 N Kraemer Blvd
Tulsa, OK 74134 Anaheim, CA 92806

Report No: NCP-RP-2008-004 Rev B
Report Date: October 20, 2023
Page 2 of 104
Edited by:
Evelyn Lian
Reviewed by:
Elizabeth Clarkson, Ph.D
Approved by:
Royal Lovingfoss
REVISIONS:
Rev By Date Rev App
By
Pages Revised or Added
N/C Elizabeth
Clarkso
n
3/25/2016 Royal
Lovin
g
foss
Document Initial Release
A Elizabeth
Clarkson
10/5/2021 Royal
Lovingfoss
Updated Table 3-4 page 37 with corrected
value for “Hard” layup to 50/40/10. Updated
DMA measurements in Tables 3-3 and 3-4 on
pages 36 and 37.
B Evelyn
Lian
10/20/2023 Royal
Lovingfoss
- Editorial changes
- Updated reference of “CMH-17 Rev G” to
“CMH-17-1G”
- Updated IPS data for all conditions;
affected sections also updated in Tables 3-1
(Pg. 33), 3-3 (Pg. 35), 4-11 (Pg. 52), 4-12
(Pg. 52), 4-13 (Pg. 53) and 6-1 (Pg. 103),
Figures 4-7 (Pg. 51) and 4-8 (Pg. 51), and
Section 4.7 (P
g
. 50).
Evelyn Lian
Digitally signed by Evelyn
Lian
Date: 2023.11.07
09:11:01 -06'00'
Dr. Elizabeth
Clarkson
Digitally signed by Dr. Elizabeth Clarkson
DN: cn=Dr. Elizabeth Clarkson, o=NAIR,
ou=NCAMP,
[email protected], c=US
Date: 2023.11.08 08:24:36 -06'00'
Royal
Lovingfoss
Digitally signed by Royal
Lovingfoss
Date: 2023.11.09
19:42:33 -06'00'
October 20, 2023 NCP-RP-2008-004 Rev B
Page 3 of 104
Table of Contents
1. Introduction ........................................................................................................................... 8
1.1 Symbols and Abbreviations ............................................................................................. 9
1.2 Pooling Across Environments ........................................................................................ 10
1.3 Basis Value Computational Process .............................................................................. 11
1.4 Modified Coefficient of Variation (CV) Method .......................................................... 11
2. Background ......................................................................................................................... 13
2.1 ASAP Statistical Formulas and Computations ............................................................ 13
2.1.1 Basic Descriptive Statistics ........................................................................................... 13
2.1.2 Statistics for Pooled Data .............................................................................................. 13
2.1.3 Basis Value Computations ............................................................................................ 14
2.1.4 Modified Coefficient of Variation ................................................................................ 15
2.1.5 Determination of Outliers ............................................................................................. 16
2.1.6 The k-Sample Anderson Darling Test for batch equivalency ....................................... 17
2.1.7 The Anderson Darling Test for Normality.................................................................... 18
2.1.8 Levene’s test for Equality of Coefficient of Variation ................................................. 19
2.2 STAT-17 ........................................................................................................................... 19
2.2.1 Distribution tests ........................................................................................................... 20
2.2.2 Computing Normal Distribution Basis values .............................................................. 20
2.2.3 Non-parametric Basis Values ....................................................................................... 24
2.2.4 Non-parametric Basis Values for small samples .......................................................... 25
2.2.5 Analysis of Variance (ANOVA) Basis Values ............................................................. 27
2.3 Single Batch and Two Batch estimates using modified CV ........................................ 29
2.4 Lamina Variability Method (LVM) .............................................................................. 29
2.5 0º Lamina Strength Derivation ...................................................................................... 31
2.5.1 0º Lamina Strength Derivation (Alternate Formula) ................................................... 31
3. Summary of Results ............................................................................................................ 32
3.1 NCAMP Recommended B-basis Values ....................................................................... 32
3.2 Lamina and Laminate Summary Tables ...................................................................... 35
4. Lamina Test Results, Statistics, Basis Values and Graphs ............................................. 37
4.1 Longitudinal (0º) Tension Properties (LT) ................................................................... 38
4.2 Transverse (90º) Tension Properties (TT) .................................................................... 40
4.3 Longitudinal (0º) Compression Properties (LC) .......................................................... 42
4.4 Transverse (90º) Compression Properties (TC) ........................................................... 44
4.5 Unnotched Tension Properties (UNT0) ........................................................................ 46
4.6 Unnotched Compression Properties (UNC0) ............................................................... 48
4.7 In-Plane Shear Properties (IPS) .................................................................................... 50
4.8 Short Beam Strength (SBS)............................................................................................ 54
5. Laminate Test Results, Statistics and Basis Values ......................................................... 56
5.1 Unnotched Tension Properties....................................................................................... 56
5.1.1 Quasi Isotropic Unnotched Tension (UNT1) ................................................................ 56
October 20, 2023 NCP-RP-2008-004 Rev B
Page 4 of 104
5.1.2 “Soft” Unnotched Tension (UNT2) .............................................................................. 58
5.1.3 “Hard” Unnotched Tension (UNT3) ............................................................................. 60
5.2 Unnotched Compression Properties .............................................................................. 62
5.2.1 Quasi Isotropic Unnotched Compression (UNC1) ....................................................... 62
5.2.2 “Soft” Unnotched Compression (UNC2) ...................................................................... 64
5.2.3 “Hard” Unnotched Compression (UNC3) .................................................................... 66
5.3 Laminate Short Beam Shear Properties (LSBS) .......................................................... 68
5.4 Open Hole Tension Properties ....................................................................................... 70
5.4.1 Quasi Isotropic Open Hole Tension (OHT1) ................................................................ 70
5.4.2 “Soft” Open Hole Tension (OHT2) .............................................................................. 72
5.4.3 “Hard” Open Hole Tension (OHT3) ............................................................................. 74
5.5 Open Hole Compression Properties .............................................................................. 76
5.5.1 Quasi Isotropic Open Hole Compression (OHC1) ....................................................... 76
5.5.2 “Soft” Open Hole Compression (OHC2) ...................................................................... 78
5.5.3 “Hard” Open Hole Compression (OHC3) .................................................................... 80
5.6 Filled Hole Tension Properties ...................................................................................... 82
5.6.1 Quasi Isotropic Filled Hole Tension (FHT1) ................................................................ 82
5.6.2 “Soft” Filled Hole Tension (FHT2) .............................................................................. 84
5.6.3 “Hard” Filled Hole Tension (FHT3) ............................................................................. 85
5.7 Filled Hole Compression Properties.............................................................................. 86
5.7.1 Quasi Isotropic Filled Hole Compression (FHC1) ....................................................... 86
5.7.2 “Soft” Filled Hole Compression (FHC2) ...................................................................... 88
5.7.3 “Hard” Filled Hole Compression (FHC3) .................................................................... 90
5.8 Pin Bearing Properties ................................................................................................... 92
5.8.1 Quasi Isotropic Pin Bearing (PB1) ............................................................................... 92
5.8.2 “Soft” Pin Bearing (PB2) .............................................................................................. 95
5.8.3 “Hard” Pin Bearing (PB3) ............................................................................................ 98
5.9 Compression After Impact Properties (CAI) ............................................................. 101
5.10 Interlaminar Tension (ILT) and Curved Beam Strength (CBS) .............................. 102
6. Outliers............................................................................................................................... 103
7. References .......................................................................................................................... 104
October 20, 2023 NCP-RP-2008-004 Rev B
Page 5 of 104
List of Figures
Figure 4-1: Batch Plot for LT Strength normalized ................................................................ 38
Figure 4-2: Batch Plot for TT Strength as measured .............................................................. 40
Figure 4-3: Batch Plot for LC Strength normalized ................................................................ 42
Figure 4-4: Batch Plot for TC Strength data............................................................................ 44
Figure 4-5: Batch plot for UNT0 Strength normalized ........................................................... 46
Figure 4-6: Batch plot for UNC0 Strength normalized ........................................................... 48
Figure 4-7: Batch plot for IPS Strength at 5% Strain as measured ...................................... 51
Figure 4-8: Batch plot for IPS 0.2% Offset Strength as measured ........................................ 51
Figure 4-9: Batch plot for SBS as measured ............................................................................ 54
Figure 5-1: Batch plot for UNT1 Strength normalized ........................................................... 56
Figure 5-2: Batch plot for UNT2 Strength normalized ........................................................... 58
Figure 5-3: Batch plot for UNT3 Strength normalized ........................................................... 60
Figure 5-4: Batch plot for UNC1 Strength normalized ........................................................... 62
Figure 5-5: Batch plot for UNC2 Strength normalized ........................................................... 64
Figure 5-6: Batch plot for UNC3 Strength normalized ........................................................... 66
Figure 5-7: Batch plot for LSBS as measured .......................................................................... 68
Figure 5-8: Batch plot for OHT1 Strength normalized ........................................................... 70
Figure 5-9: Batch plot for OHT2 Strength normalized ........................................................... 72
Figure 5-10: Batch plot for OHT3 Strength normalized ......................................................... 74
Figure 5-11: Batch plot for OHC1 Strength normalized ........................................................ 76
Figure 5-12: Batch plot for OHC2 Strength normalized ........................................................ 78
Figure 5-13: Batch plot for OHC3 Strength normalized ........................................................ 80
Figure 5-14: Batch plot for FHT1 Strength normalized ......................................................... 82
Figure 5-15: Batch plot for FHT2 Strength normalized ......................................................... 84
Figure 5-16: Batch plot for FHT3 Strength normalized ......................................................... 85
Figure 5-17: Batch plot for FHC1 Strength normalized ......................................................... 86
Figure 5-18: Batch plot for FHC2 Strength normalized ......................................................... 88
Figure 5-19: Batch plot for FHC3 Strength normalized ......................................................... 90
Figure 5-20: Batch plot for PB1 2% Offset Strength normalized .......................................... 93
Figure 5-21: Batch plot for PB1 Ultimate Strength normalized ............................................. 93
Figure 5-22: Batch plot for PB2 2% Offset Strength normalized .......................................... 95
Figure 5-23: Batch plot for PB2 Ultimate Strength normalized ............................................. 96
Figure 5-24: Batch plot for PB3 2% Offset Strength normalized .......................................... 98
Figure 5-25: Batch plot for PB3 Ultimate Strength normalized ............................................. 99
Figure 5-26: Batch plot for CAI Strength normalized .......................................................... 101
Figure 5-27: Plot for ILT and CBS Data as measured .......................................................... 102
October 20, 2023 NCP-RP-2008-004 Rev B
Page 6 of 104
List of Tables
Table 1-1: Test Property Abbreviations ..................................................................................... 9
Table 1-2: Test Property Symbols ............................................................................................. 10
Table 1-3: Environmental Conditions Abbreviations ............................................................. 10
Table 2-1: K factors for normal distribution ........................................................................... 21
Table 2-2: Weibull Distribution Basis Value Factors .............................................................. 23
Table 2-3: B-Basis Hanson-Koopmans Table .......................................................................... 26
Table 2-4: A-Basis Hanson-Koopmans Table .......................................................................... 27
Table 2-5: B-Basis factors for small datasets using variability of corresponding large
dataset .......................................................................................................................................... 30
Table 3-1 : NCAMP recommended B-basis values for lamina test data ............................... 33
Table 3-2 : NCAMP Recommended B-basis values for laminate test data ........................... 34
Table 3-3: Summary of Test Results for Lamina Data ........................................................... 35
Table 3-4: Summary of Test Results for Laminate Data ........................................................ 36
Table 4-1: Statistics and Basis Values for LT Strength data .................................................. 39
Table 4-2: Statistics from LT modulus data ............................................................................. 39
Table 4-3: Statistics and Basis Values for TT Strength and Modulus data .......................... 41
Table 4-4: Statistics and B-Basis values for LC Strength data ............................................... 43
Table 4-5: Statistics from LC modulus data............................................................................. 43
Table 4-6: Statistics and Basis Values for TC Strength and Modulus data .......................... 45
Table 4-7: Statistics and Basis Values for UNT0 Strength data ............................................. 47
Table 4-8: Statistics from UNT0 Modulus data ....................................................................... 47
Table 4-9: Statistics and Basis Values for UNC0 Strength data ............................................. 49
Table 4-10: Statistics from UNC0 Modulus data ..................................................................... 49
Table 4-11: Statistics and Basis Values for IPS Strength at 5% Strain data ........................ 52
Table 4-12: Statistics and Basis Values for IPS 0.2% Offset Strength data .......................... 52
Table 4-13: Statistics from IPS Modulus data ......................................................................... 53
Table 4-14: Statistics and Basis Values for SBS data .............................................................. 55
Table 5-1: Statistics and Basis Values for UNT1 Strength data ............................................. 57
Table 5-2: Statistics from UNT1 Modulus Data....................................................................... 57
Table 5-3: Statistics and Basis Values for UNT2 Strength data ............................................. 59
Table 5-4: Statistics from UNT2 Modulus Data....................................................................... 59
Table 5-5: Statistics and Basis Values for UNT3 Strength data ............................................. 60
Table 5-6: Statistics for UNT3 Modulus data........................................................................... 61
Table 5-7: Statistics and Basis Values for UNC1 Strength data ............................................. 63
Table 5-8: Statistics from UNC1 Modulus data ....................................................................... 63
Table 5-9: Statistics and Basis Values for UNC2 Strength data ............................................. 65
Table 5-10: Statistics from UNC2 Modulus data ..................................................................... 65
Table 5-11: Statistics and Basis Values for UNC3 Strength data ........................................... 67
Table 5-12: Statistics from UNC3 Modulus Data .................................................................... 67
Table 5-13: Statistics and Basis Values for LSBS data ........................................................... 69
Table 5-14: Statistics and Basis Values for OHT1 Strength data .......................................... 71
Table 5-15: Statistics and Basis Values for OHT2 Strength data .......................................... 73
Table 5-16: Statistics and Basis Values for OHT3 Strength data .......................................... 75
Table 5-17: Statistics and Basis Values for OHC1 Strength data .......................................... 77
Table 5-18: Statistics and Basis Values for OHC2 Strength data .......................................... 79
October 20, 2023 NCP-RP-2008-004 Rev B
Page 7 of 104
Table 5-19: Statistics and Basis Values for OHC3 Strength data .......................................... 81
Table 5-20: Statistics and Basis Values for FHT1 Strength data ........................................... 83
Table 5-21: Statistics and Basis Values for FHT2 Strength data ........................................... 84
Table 5-22: Statistics and Basis Values for FHT3 Strength data ........................................... 85
Table 5-23: Statistics and Basis Values for FHC1 Strength data ........................................... 87
Table 5-24: Statistics and Basis Values for FHC2 Strength data ........................................... 89
Table 5-25: Statistics and Basis Values for FHC3 Strength data ........................................... 91
Table 5-26: Statistics and Basis Values for PB1 2% Offset Strength data ............................ 94
Table 5-27: Statistics and Basis Values for PB1 Ultimate Strength data .............................. 94
Table 5-28: Statistics and Basis Values for PB2 2% Offset Strength data ............................ 96
Table 5-29: Statistics and Basis Values for PB2 Ultimate Strength data .............................. 97
Table 5-30: Statistics and Basis Values for PB3 2% Offset Strength data ............................ 99
Table 5-31: Statistics and Basis Values for PB3 Ultimate Strength data ............................ 100
Table 5-32: Statistics and Basis Values for CAI data ............................................................ 101
Table 5-33: Statistics for ILT and CBS data .......................................................................... 102
Table 6-1: List of outliers ......................................................................................................... 103
October 20, 2023 NCP-RP-2008-004 Rev B
Page 8 of 104
1. Introduction
This report contains statistical analysis of ACG MTM45-1/AS4-145-32%RW material property
data published in “MTM45-1 AS4 Data MH Cure Cycle.pdf”, available on the NCAMP website.
The lamina and laminate material property data have been generated with FAA oversight
through FAA Special Project Number SP3505WI-Q and also meet the requirements outlined in
NCAMP Standard Operating Procedure NSP 100.
B-Basis values and A and B-basis estimates were computed using a variety of techniques that are
detailed in section 2. Qualification material was procured in accordance with ACG material
specification ACGM 1001-11. An equivalent NCAMP Material Specification NMS 451/11
which contains specification limits that are derived from guidelines in DOT/FAA/AR-03/19 has
been created. The qualification test panels were fabricated per ACGP1001-02 using “MH” cure
cycle. An equivalent NCAMP Process Specification NPS 81451 with “MH” cure cycle has been
created. The panels were fabricated at Advanced Composites Group, 5350 E. 129
th
E. Ave.
Tulsa, OK 74134 and Solvay, 1440 N Kraemer Blvd, Anaheim, CA 92806. The ACG Test Plan
AI/TR/1392 was used for this qualification program. The mechanical testing was performed by
ACG at their Tulsa, Oklahoma facility and National Institute for Aviation Research, Wichita
State University, Wichita, KS 67260.
Basis numbers are labeled as ‘values’ when the data meets all the requirements of CMH-17-1G.
When those requirements are not met, they will be labeled as ‘estimates.’ When the data does
not meet all requirements, the failure to meet these requirements is reported and the specific
requirement(s) the data fails to meet is identified. The method used to compute the basis value is
noted for each basis value provided. When appropriate, in addition to the traditional
computational methods, values computed using the modified coefficient of variation method is
also provided.
The material property data acquisition process is designed to generate basic material property
data with sufficient pedigree for submission to Complete Documentation sections of Composite
Materials Handbook 17 (CMH-17-1G).
The NCAMP shared material property database contains material property data of common
usefulness to a wide range of aerospace projects. However, the data may not fulfill all the needs
of a project. Specific properties, environments, laminate architecture, and loading situations that
individual projects need may require additional testing.
The use of NCAMP material and process specifications do not guarantee material or structural
performance. Material users should be actively involved in evaluating material performance and
quality including, but not limited to, performing regular purchaser quality control tests,
performing periodic equivalency/additional testing, participating in material change management
activities, conducting statistical process control, and conducting regular supplier audits.
The applicability and accuracy of NCAMP material property data, material allowables, and
specifications must be evaluated on case-by-case basis by aircraft companies and certifying
agencies. NCAMP assumes no liability whatsoever, expressed or implied, related to the use of
the material property data, material allowables, and specifications.

October 20, 2023 NCP-RP-2008-004 Rev B
Page 9 of 104
Part fabricators that wish to utilize the material property data, allowables, and specifications may
be able to do so by demonstrating the capability to reproduce the original material properties; a
process known as equivalency. More information about this equivalency process including the
test statistics and its limitations can be found in Section 6 of DOT/FAA/AR-03/19 and Section
8.4.1 of CMH-17-1G. The applicability of equivalency process must be evaluated on program-
by-program basis by the applicant and certifying agency. The applicant and certifying agency
must agree that the equivalency test plan along with the equivalency process described in Section
6 of DOT/FAA/AR-03/19 and Section 8.4.1 of CMH-17-1G are adequate for the given program.
Aircraft companies should not use the data published in this report without specifying NCAMP
Material Specification NMS 451/11. NMS 451/11 has additional requirements that are listed in
its prepreg process control document (PCD), fiber specification, fiber PCD, and other raw
material specifications and PCDs which impose essential quality controls on the raw materials
and raw material manufacturing equipment and processes. Aircraft companies and certifying
agencies should assume that the material property data published in this report is not applicable
when the material is not procured to NCAMP Material Specification NMS 451/11. NMS 451/11
is a free, publicly available, non-proprietary aerospace industry material specification.
This report is intended for general distribution to the public, either freely or at a price that does
not exceed the cost of reproduction (e.g. printing) and distribution (e.g. postage).
1.1 Symbols and Abbreviations
Test Property Abbreviation
Lon
g
itudinal Compression LC
Lon
g
itudinal Tensio
n
LT
Transverse Compression TC
Transverse Tensio
n
TT
In Plane Shea
r
IPS
Unnotched Tension UNT
Unnotched Compression UNC
Short Beam Stren
g
th SBS
Laminate Short Beam Stren
g
th LSBS
Open Hole Tensio
n
OHT
Open Hole Compression OHC
Filled Hole Tensio
n
FHT
Filled Hole Compression FHC
Pin Bearin
g
Stren
g
th PB
Curved Beam Stren
g
th CBS
Interlaminar Tensio
n
ILT
Table 1-1: Test Property Abbreviations

October 20, 2023 NCP-RP-2008-004 Rev B
Page 10 of 104
Test Property Symbol
Lon
g
itudinal Compression Stren
g
th F
1
cu
Lon
g
itudinal Compression Modulus E
1
c
Lon
g
itudinal Compression Poisson’s Ratio ν
12
c
Lon
g
itudinal Tension Stren
g
th F
1
tu
Lon
g
itudinal Tension Modulus E
1
t
T
r
ansverse Compression Stren
g
th F
2
cu
Transverse Compression Modulus E
2
c
Transverse Compression Poisson’s Ratio ν
21
c
Transverse Tension Stren
g
th F
2
tu
Transverse Tension Modulus E
2
t
In Plane Shear Stren
g
th at 5% strai
n
F
12
s5%
In Plane Shear Stren
g
th
a
t 0.2% offset F
12
s0.2%
In Plane Shear Modulus G
12
s
Table 1-2: Test Property Symbols
Environmental Condition Temperature Abbreviation
Cold Temperature Dr
y
−65°F CTD
R
oom Temperature Dr
y
75°F RTD
Elevated Temperature Dr
y
200°F ETD
Elevated Temperature Wet 200°F ETW
Elevated Temperature Wet 250°F ETW2
Table 1-3: Environmental Conditions Abbreviations
Tests with a number immediately after the abbreviation indicate the lay-up:
1 = “Quasi-Isotropic”
2 = “Soft”
3 = “Hard”
EX: OHT1 is an open hole tension test with a quasi-isotropic layup.
1.2 Pooling Across Environments
When pooling across environments was allowable, the pooled co-efficient of variation was used.
ASAP (AGATE Statistical Analysis Program) 2008 version 1.0 was used to determine if pooling
was allowable and to compute the pooled coefficient of variation for those tests. In these cases,
the modified coefficient of variation based on the pooled data was used to compute the basis
values.
When pooling across environments was not allowable, (i.e. the data failed the Anderson-Darling
test or normality tests and engineering judgment indicated there was no justification for
overriding the result), B-Basis values were computed for each environment separately using Stat-
17 version 5.

October 20, 2023 NCP-RP-2008-004 Rev B
Page 11 of 104
1.3 Basis Value Computational Process
The general form to compute engineering basis values is: basis value =
X
kS where k is a
factor based on the sample size and the distribution of the sample data. There are many different
methods to determine the value of k in this equation, depending on the sample size and the
distribution of the data. In addition, the computational formula used for the standard deviation,
S, may vary depending on the distribution of the data. The details of those different
computations and when each should be used are in section 2.0.
1.4 Modified Coefficient of Variation (CV) Method
A common problem with new material qualifications is that the initial specimens produced and
tested do not contain all of the variability that will be encountered when the material is being
produced in larger amounts over a lengthy period of time. This can result in setting basis values
that are unrealistically high. The variability as measured in the qualification program is often
lower than the actual material variability because of several reasons. The materials used in the
qualification programs are usually manufactured within a short period of time, typically 2-3
weeks only, which is not representative of the production material. Some raw ingredients that
are used to manufacture the multi-batch qualification materials may actually be from the same
production batches or manufactured within a short period of time so the qualification materials,
although regarded as multiple batches, may not truly be multiple batches so they are not
representative of the actual production material variability.
The modified Coefficient of Variation (CV) used in this report is in accordance with section
8.4.4 of CMH-17-1G. It is a method of adjusting the original basis values downward in
anticipation of the expected additional variation. Composite materials are expected to have a CV
of at least 6%. The modified coefficient of variation (CV) method increases the measured
coefficient of variation when it is below 8% prior to computing basis values. A higher CV will
result in lower or more conservative basis values and lower specification limits. The use of the
modified CV method is intended for a temporary period of time when there is minimal data
available. When a sufficient number of production batches (approximately 8 to 15) have been
produced and tested, the as-measured CV may be used so that the basis values and specification
limits may be adjusted higher.
The material allowables in this report are calculated using both the as-measured CV and
modified CV, so users have the choice of using either one. When the measured CV is greater
than 8%, the modified CV method does not change the basis value. NCAMP recommended
values make use the modified CV method when it is appropriate for the data.
When the data fails the Anderson-Darling K-sample test for batch to batch variability or when
the data fails the normality test, the modified CV method is not appropriate and no modified CV
basis value will be provided. When the ANOVA method is used, it may produce excessively
conservative basis values. When appropriate, a single batch or two batch estimate may be
provided in addition to the ANOVA estimate.
October 20, 2023 NCP-RP-2008-004 Rev B
Page 12 of 104
In some cases a transformation of the data to fit the assumption of the modified CV resulted in
the transformed data passing the ADK test and thus the data can be pooled only for the modified
CV method.
NCAMP recommends that if a user decides to use the basis values that are calculated from as-
measured CV, the specification limits and control limits be calculated with as-measured CV also.
Similarly, if a user decides to use the basis values that are calculated from modified CV, the
specification limits and control limits be calculated with modified CV also. This will ensure that
the link between material allowables, specification limits, and control limits is maintained.
October 20, 2023 NCP-RP-2008-004 Rev B
Page 13 of 104
2. Background
Statistical computations are performed with AGATE Statistical Analysis Program (ASAP) when
pooling across environments is permissible according to CMH-17-1G guidelines. If pooling is
not permissible, a single point analysis using STAT-17 is performed for each environmental
condition with sufficient test results. If the data does not meet the CMH-17-1G requirements for
a single point analysis, estimates are created by a variety of methods depending on which is most
appropriate for the dataset available. Specific procedures used are presented in the individual
sections where the data is presented.
2.1 ASAP Statistical Formulas and Computations
This section contains the details of the specific formulas ASAP uses in its computations.
2.1.1 Basic Descriptive Statistics
The basic descriptive statistics shown are computed according to the usual formulas, which
are shown below:
Mean:
1
n
i
i
X
X
n
Equation 1
Std. Dev.:
2
1
1
1
n
i
n
i
SXX
Equation 2
% Co. Variation:
100
S
X
Equation 3
Where n refers to the number of specimens in the sample and
X
i
refers to the individual specimen measurements.
2.1.2 Statistics for Pooled Data
Prior to computing statistics for the pooled dataset, the data is normalized to a mean of one by
dividing each value by the mean of all the data for that condition. This transformation does not
affect the coefficients of variation for the individual conditions.
2.1.2.1 Pooled Standard Deviation
The formula to compute a pooled standard deviation is given below:
October 20, 2023 NCP-RP-2008-004 Rev B
Page 14 of 104
Pooled Std. Dev.
2
1
1
1
1
k
ii
i
p
k
i
i
nS
S
n
Equation 4
Where k refers to the number of batches and n
i
refers to the number of specimens in the i
th
sample.
2.1.2.2 Pooled Coefficient of Variation
Since the mean for the normalized data is 1.0 for each condition, the pooled normalized data also
has a mean of one. The coefficient of variation for the pooled normalized data is the pooled
standard deviation divided by the pooled mean, as in equation 3. Since the mean for the pooled
normalized data is one, the pooled coefficient of variation is equal to the pooled standard
deviation of the normalized data.
Pooled Coefficient of Variation
1
p
p
S
S
Equation 5
2.1.3 Basis Value Computations
Basis values are computed using the mean and standard deviation for that environment, as
follows: The mean is always the mean for the environment, but if the data meets all
requirements for pooling, S
p
can be used in place of the standard deviation for the environment,
S.
Basis Values:
a
b
A basis X K S
B
basis X K S
Equation 6
2.1.3.1 K-factor computations
K
a
and K
b
are computed according to the methodology documented in section 8.3.5 of CMH-17-
1G. The approximation formulas are given below:
2
() ()
2.3263 1
() 2 () 2 ()
()
AA
a
Aj A A
bf bf
K
cfn cf cf
qf
Equation 7
2
() ()1.2816 1
() 2 () 2 ()
()
BB
b
BjB B
bf bf
K
cfn cf cf
qf
Equation 8
Where
r = the number of environments being pooled together
n
j
= number of data values for environment j
October 20, 2023 NCP-RP-2008-004 Rev B
Page 15 of 104
1
r
j
j
Nn
f = N−r
2
2.323 1.064 0.9157 0.6530
() 1qf
ff
fff
Equation 9
1.1372 0.49162 0.18612
()
B
bf
f
f
ff
Equation 10
0.0040342 0.71750 0.19693
( ) 0.36961
B
cf
f
f
ff
Equation 11
2.0643 0.95145 0.51251
()
A
bf
f
f
ff
Equation 12
0.0026958 0.65201 0.011320
( ) 0.36961
A
cf
f
f
ff
Equation 13
2.1.4 Modified Coefficient of Variation
The coefficient of variation is modified according to the following rules:
Modified CV =
*
.06
.04
.04 .04 .08
2
.08
if CV
CV
CV if CV
if CV
CV
Equation 14
This is converted to percent by multiplying by 100%.
CV
*
is used to compute a modified standard deviation S
*
.
**
SCVX
Equation 15
To compute the pooled standard deviation based on the modified CV:
2
*
*
1
1
1
1
k
iii
i
p
k
i
i
nCVX
S
n
Equation 16
The A-basis and B-basis values under the assumption of the modified CV method are
computed by replacing S with S
*
October 20, 2023 NCP-RP-2008-004 Rev B
Page 16 of 104
2.1.4.1 Transformation of data based on Modified CV
In order to determine if the data would pass the diagnostic tests under the assumption of the
modified CV, the data must be transformed such that the batch means remain the same while the
standard deviation of transformed data (all batches) matches the modified standard deviation.
To accomplish this requires a transformation in two steps:
Step 1: Apply the modified CV rules to each batch and compute the modified standard
deviation
**
ii
SCVX for each batch. Transform the data in each batch as follows:
ij i ij i i
X
CX X X
Equation 17
*
i
i
i
S
C
S
Equation 18
Run the Anderson-Darling k-sample test for batch equivalence (see section 2.1.6) on the
transformed data. If it passes, proceed to step 2. If not, stop. The data cannot be pooled.
Step 2: Another transformation is needed as applying the modified CV to each batch
leads to a larger CV for the combined data than when applying the modified CV rules to
the combined data (due to the addition of between batch variation when combining data
from multiple batches). In order to alter the data to match S
*
, the transformed data is
transformed again, this time setting using the same value of C′ for all batches.
ij ij i i
X
CX X X
Equation 19
*
SSE
C
SSE
Equation 20
2
2
**
1
1
k
ii
i
SSE n CV X n X X
Equation 21
2
11
i
n
k
ij i
ij
SSE X X
Equation 22
Once this second transformation has been completed, the k-sample Anderson Darling test for
batch equivalence can be run on the transformed data to determine if the modified co-efficient of
variation will permit pooling of the data.
2.1.5 Determination of Outliers
All outliers are identified in text and graphics. If an outlier is removed from the dataset, it will
be specified and the reason why will be documented in the text. Outliers are identified using the
Maximum Normed Residual Test for Outliers as specified in section 8.3.3 of CMH-17-1G.
October 20, 2023 NCP-RP-2008-004 Rev B
Page 17 of 104
max
,1
i
all i
XX
M
NR i n
S
Equation 23
2
2
1
2
nt
C
nt
n
Equation 24
where t is the
.05
2
1
n
quartile of a t distribution with n−2 degrees of freedom.
If MNR > C, then the X
i
associated with the MNR is considered to be an outlier. If an outlier
exists, then the X
i
associated with the MNR is dropped from the dataset and the MNR procedure
is applied again. This process is repeated until no outliers are detected. Additional information
on this procedure can be found in references 1 and 2.
2.1.6 The k-Sample Anderson Darling Test for batch equivalency
The k-sample Anderson-Darling test is a nonparametric statistical procedure that tests the
hypothesis that the populations from which two or more groups of data were drawn are identical.
The distinct values in the combined data set are ordered from smallest to largest, denoted z
(1)
,
z
(2)
,… z
(L)
, where L will be less than n if there are tied observations. These rankings are used to
compute the test statistic.
The k-sample Anderson-Darling test statistic is:
2
2
11
11
(1)
4
kL
ij i j
j
j
ij
i
jj
nF n H
n
ADK h
nh
nk n
HnH
Equation 25
Where
n
i
= the number of test specimens in each batch
n = n
1
+n
2
+…+n
k
h
j
= the number of values in the combined samples equal to z
(j)
H
j
= the number of values in the combined samples less than z
(j)
plus ½ the number of
values in the combined samples equal to z
(j)
F
ij
= the number of values in the i
th
group which are less than z
(j)
plus ½ the number of
values in this group which are equal to z
(j)
.
The critical value for the test statistic at 1−α level is computed:
0.678 0.362
1
1
1
n
ADC z
k
k
. Equation 26
This formula is based on the formula in reference 3 at the end of section 5, using a Taylor's
expansion to estimate the critical value via the normal distribution rather than using the t
distribution with k-1 degrees of freedom.

October 20, 2023 NCP-RP-2008-004 Rev B
Page 18 of 104
32
2
2
()
( 1)( 2)( 3)( 1)
n
an bn cn d
VAR ADK
nn n k
Equation 27
With
2
2
2
1
1
1
21
11
(4 6)( 1) (10 6 )
(2 4) 8 (2 14 4) 8 4 6
(622) (446)(26)4
(2 6) 4
1
1
1
()
k
i
i
n
i
nn
iji
ag k gS
bgkTkgTSTg
cTgk TgkTST
dTkTk
S
n
T
i
g
nij
The data is considered to have failed this test (i.e. the batches are not from the same population)
when the test statistic is greater than the critical value. For more information on this procedure,
see reference 3.
2.1.7 The Anderson Darling Test for Normality
Normal Distribution: A two parameter (μ, σ) family of probability distributions for which the
probability that an observation will fall between a and b is given by the area under the curve
between a and b:
2
2
2
1
()
2
x
b
a
Fx e dx
Equation 28
A normal distribution with parameters (μ, σ) has population mean μ and variance σ
2
.
The normal distribution is considered by comparing the cumulative normal distribution function
that best fits the data with the cumulative distribution function of the data. Let
()
()
, for i = 1, ,n
i
i
xx
z
s
Equation 29
where x
(i)
is the smallest sample observation,
x
is the sample average, and s is the sample
standard deviation.
The Anderson Darling test statistic (AD) is:
0() 0 (1)
1
12
ln ( ) ln 1
n
ini
i
i
AD F z F z n
n
Equation 30
October 20, 2023 NCP-RP-2008-004 Rev B
Page 19 of 104
Where F
0
is the standard normal distribution function. The observed significance level
(OSL) is
**
*
0.48 0.78ln( ) 4.58
10.2
,1
1
AD AD
OSL AD AD
n
e
Equation 31
This OSL measures the probability of observing an Anderson-Darling statistic at least as
extreme as the value calculated if, in fact, the data are a sample from a normal population.
If OSL > 0.05, the data is considered sufficiently close to a normal distribution.
2.1.8 Levene’s test for Equality of Coefficient of Variation
Levene’s test performs an Analysis of Variance on the absolute deviations from their
sample medians. The absolute value of the deviation from the median is computed for
each data value.
ij ij i
wyy
An F-test is then performed on the transformed data values
as follows:
2
1
2
11
/( 1)
/( )
i
k
ii
i
n
k
iij i
ij
nw w k
F
ww nk
Equation 32
If this computed F statistic is less than the critical value for the F-distribution having k-1
numerator and n-k denominator degrees of freedom at the 1-α level of confidence, then the
data is not rejected as being too different in terms of the co-efficient of variation. ASAP
provides the appropriate critical values for F at α levels of 0.10, 0.05, 0.025, and 0.01. For
more information on this procedure, see references 4, 5, and 6.
2.2 STAT-17
This section contains the details of the specific formulas STAT-17 uses in its computations.
The basic descriptive statistics, the maximum normed residual (MNR) test for outliers, and the
Anderson Darling K-sample test for batch variability are the same as with ASAP – see sections
2.1.1, 2.1.3.1, and 2.1.5.
Outliers must be dispositioned before checking any other test results. The results of the
Anderson Darling k-Sample (ADK) Test for batch equivalency must be checked. If the data
passes the ADK test, then the appropriate distribution is determined. If it does not pass the ADK
test, then the ANOVA procedure is the only approach remaining that will result in basis values
that meet the requirements of CMH-17-1G.
October 20, 2023 NCP-RP-2008-004 Rev B
Page 20 of 104
2.2.1 Distribution tests
In addition to testing for normality using the Anderson-Darling test (see 2.1.7); Stat-17 also tests
to see if the Weibull or Lognormal distribution is a good fit for the data.
Each distribution is considered using the Anderson-Darling test statistic which is sensitive to
discrepancies in the tail regions. The Anderson-Darling test compares the cumulative
distribution function for the distribution of interest with the cumulative distribution function of
the data.
An observed significance level (OSL) based on the Anderson-Darling test statistic is computed
for each test. The OSL measures the probability of observing an Anderson-Darling test statistic
at least as extreme as the value calculated if the distribution under consideration is in fact the
underlying distribution of the data. In other words, the OSL is the probability of obtaining a
value of the test statistic at least as large as that obtained if the hypothesis that the data are
actually from the distribution being tested is true. If the OSL is less than or equal to 0.05, then
the assumption that the data are from the distribution being tested is rejected with at most a five
percent risk of being in error.
If the normal distribution has an OSL greater than 0.05, then the data is assumed to be from a
population with a normal distribution. If not, then if either the Weibull or lognormal
distributions has an OSL greater than 0.05, then one of those can be used. If neither of these
distributions has an OSL greater than 0.05, a non-parametric approach is used.
In what follows, unless otherwise noted, the sample size is denoted by n, the sample observations
by x
1
, ..., x
n
, and the sample observations ordered from least to greatest by x
(1)
, ..., x
(n)
.
2.2.2 Computing Normal Distribution Basis values
Stat-17 uses a table of values for the k-factors (shown in Table 2-1) when the sample size is less
than 16 and a slightly different formula than ASAP to compute approximate k-values for the
normal distribution when the sample size is 16 or larger.

October 20, 2023 NCP-RP-2008-004 Rev B
Page 21 of 104
N B-basis A-basis
2 20.581 37.094
3 6.157 10.553
4 4.163 7.042
5 3.408 5.741
6 3.007 5.062
7 2.756 4.642
8 2.583 4.354
9 2.454 4.143
10 2.355 3.981
11 2.276 3.852
12 2.211 3.747
13 2.156 3.659
14 2.109 3.585
15 2.069 3.520
Norm. Dist. k Factors for N<16
Table 2-1: K factors for normal distribution
2.2.2.1 One-sided B-basis tolerance factors, k
B
, for the normal distribution when sample
size is greater than 15.
The exact computation of k
B
values is 1 n times the 0.95th quantile of the noncentral
t-distribution with noncentrality parameter
1.282 n and n − 1 degrees of freedom. Since this in
not a calculation that Excel can handle, the following approximation to the
k
B
values is used:
1.282 exp{0.958 0.520 ln( ) 3.19 }
B
knn Equation 33
This approximation is accurate to within 0.2% of the tabulated values for sample sizes greater
than or equal to 16.
2.2.2.2 One-sided A-basis tolerance factors, k
A
, for the normal distribution
The exact computation of k
B
values is
1 n
times the 0.95th quantile of the noncentral
t-distribution with noncentrality parameter
2.326 n and n − 1 degrees of freedom (Reference
12). Since this is not a calculation that Excel can handle easily, the following approximation to
the
k
B
values is used:
2.326 exp{1.34 0.522ln( ) 3.87 }
A
knn Equation 34
This approximation is accurate to within 0.2% of the tabulated values for sample sizes greater than
or equal to 16.
2.2.2.3 Two-parameter Weibull Distribution
A probability distribution for which the probability that a randomly selected observation from
this population lies between a and b
0 ab is given by
b
a
ee
Equation 35
where α is called the scale parameter and β is called the shape parameter.
October 20, 2023 NCP-RP-2008-004 Rev B
Page 22 of 104
In order to compute a check of the fit of a data set to the Weibull distribution and compute basis
values assuming Weibull, it is first necessary to obtain estimates of the population shape and
scale parameters (Section 2.2.2.3.1). Calculations specific to the goodness-of-fit test for the
Weibull distribution are provided in section 2.2.2.3.2.
2.2.2.3.1 Estimating Weibull Parameters
This section describes the maximum likelihood method for estimating the parameters of the two-
parameter Weibull distribution. The maximum-likelihood estimates of the shape and scale
parameters are denoted
ˆ
and
ˆ
. The estimates are the solution to the pair of equations:
0x
ˆ
ˆ
n
ˆ
ˆ
n
1i
ˆ
i
1
ˆ
Equation 36
ˆ
11
ˆˆ
ln ln ln ln 0
ˆ
ˆ
nn
i
ii
ii
x
n
nx x
Equation 37
Stat-17 solves these equations numerically for
ˆ
and
ˆ
in order to compute basis values.
2.2.2.3.2 Goodness-of-fit test for the Weibull distribution
The two-parameter Weibull distribution is considered by comparing the cumulative
Weibull distribution function that best fits the data with the cumulative distribution function of
the data. Using the shape and scale parameter estimates from section 2.2.2.3.1, let
ˆ
ˆ
, for 1, ,
ii
zx i n
Equation 38
The Anderson-Darling test statistic is
n
(i) (n+1-i)
i=1
1-2i
AD = n 1 - exp( ) - - n
zz
n
Equation 39
and the observed significance level is
**
OSL = 1/ 1+ exp[-0.10 +1.24ln( ) + 4.48 ]
AD AD
Equation 40
where
*
0.2
1AD AD
n
Equation 41
This OSL measures the probability of observing an Anderson-Darling statistic at least as extreme
as the value calculated if in fact the data is a sample from a two-parameter Weibull distribution.
If OSL 0.05, one may conclude (at a five percent risk of being in error) that the population
does not have a two-parameter Weibull distribution. Otherwise, the hypothesis that the
population has a two-parameter Weibull distribution is not rejected. For further information on
these procedures, see reference 7.

October 20, 2023 NCP-RP-2008-004 Rev B
Page 23 of 104
2.2.2.3.3 Basis value calculations for the Weibull distribution
For the two-parameter Weibull distribution, the B-basis value is
ˆ
ˆ
V
n
Bqe
Equation 42
where
1
ˆ
ˆ
ˆ
0.10536q
Equation 43
To calculate the A-basis value, substitute the equation below for the equation above.
1/
ˆ
ˆ
q (0.01005)
Equation 44
V is the value in Table 2-2. when the sample size is less than 16. For sample sizes of 16 or
larger, a numerical approximation to the V values is given in the two equations immediately
below.
5.1
3.803 exp 1.79 0.516ln( )
1
B
Vn
n
Equation 45
4.76
6.649 exp 2.55 0.526ln( )
A
Vn
n
Equation 46
This approximation is accurate within 0.5% of the tabulated values for n greater than or equal to
16.
N B-basis A-basis
2 690.804 1284.895
3 47.318 88.011
4 19.836 36.895
5 13.145 24.45
6 10.392 19.329
7 8.937 16.623
8 8.047 14.967
9 7.449 13.855
10 6.711 12.573
11 6.477 12.093
12 6.286 11.701
13 6.127 11.375
14 5.992 11.098
15 5.875 10.861
Weibull Dist. K Factors for N<16
Table 2-2: Weibull Distribution Basis Value Factors
2.2.2.4 Lognormal Distribution
A probability distribution for which the probability that an observation selected at random from
this population falls between
a and b
0 ab
is given by the area under the normal
distribution between ln(a) and ln(b).

October 20, 2023 NCP-RP-2008-004 Rev B
Page 24 of 104
The lognormal distribution is a positively skewed distribution that is simply related to the normal
distribution. If something is lognormally distributed, then its logarithm is normally distributed.
The natural (base e) logarithm is used.
2.2.2.4.1 Goodness-of-fit test for the Lognormal distribution
In order to test the goodness-of-fit of the lognormal distribution, take the logarithm of the data
and perform the Anderson-Darling test for normality from Section 2.1.7. Using the natural
logarithm, replace the linked equation above with linked equation below:
ln
, for 1, ,
L
i
i
L
xx
zin
s
Equation 47
where x
(i)
is the i
th
smallest sample observation,
L
x
and s
L
are the mean and standard deviation of
the ln(x
i
) values.
The Anderson-Darling statistic is then computed using the linked equation above and the
observed significance level (OSL) is computed using the linked equation above . This OSL
measures the probability of observing an Anderson-Darling statistic at least as extreme as
the value calculated if in fact the data are a sample from a lognormal distribution. If
OSL 0.05, one may conclude (at a five percent risk of being in error) that the population
is not lognormally distributed. Otherwise, the hypothesis that the population is
lognormally distributed is not rejected. For further information on these procedures, see
reference 7.
2.2.2.4.2 Basis value calculations for the Lognormal distribution
If the data set is assumed to be from a population with a lognormal distribution, basis values are
calculated using the equation above in section 2.1.3. However, the calculations are performed
using the logarithms of the data rather than the original observations. The computed basis values
are then transformed back to the original units by applying the inverse of the log transformation.
2.2.3 Non-parametric Basis Values
Non-parametric techniques do not assume any particularly underlying distribution for the
population the sample comes from. It does require that the batches be similar enough to be
grouped together, so the ADK test must have a positive result. While it can be used instead of
assuming the normal, lognormal or Weibull distribution, it typically results in lower basis values.
One of following two methods should be used, depending on the sample size.
2.2.3.1 Non-parametric Basis Values for large samples
The required sample sizes for this ranking method differ for A and B basis values. A sample size
of at least 29 is needed for the B-basis value while a sample size of 299 is required for the A-
basis.
To calculate a B-basis value for n > 28, the value of r is determined with the following formulas:
October 20, 2023 NCP-RP-2008-004 Rev B
Page 25 of 104
For B-basis values:
9
1.645 0.23
10 100
B
nn
r
Equation 48
For A-Basis values:
99 19.1
1.645 0.29
100 10,000
A
nn
r
n
Equation 49
The formula for the A-basis values should be rounded to the nearest integer. This approximation
is exact for most values and for a small percentage of values (less than 0.2%), the approximation
errs by one rank on the conservative side.
The B-basis value is the r
B
th
lowest observation in the data set, while the A-basis values are the
r
A
th
lowest observation in the data set. For example, in a sample of size n = 30, the lowest (r = 1)
observation is the B-basis value. Further information on this procedure may be found in
reference 8.
2.2.4 Non-parametric Basis Values for small samples
The Hanson-Koopmans method (references 9 and 10) is used for obtaining a B-basis value for
sample sizes not exceeding 28 and A-basis values for sample sizes less than 299. This procedure
requires the assumption that the observations are a random sample from a population for which
the logarithm of the cumulative distribution function is concave, an assumption satisfied by a
large class of probability distributions. There is substantial empirical evidence that suggests that
composite strength data satisfies this assumption.
The Hanson-Koopmans B-basis value is:
1
k
r
r
x
Bx
x
Equation 50
The A-basis value is:
1
k
n
n
x
Ax
x
Equation 51
where x
(n)
is the largest data value, x
(1)
is the smallest, and x
(r)
is the r
th
largest data value. The
values of r and k depend on n and are listed in Table 2-3. This method is not used for the B-basis
value when x
(r)
= x
(1)
.
The Hanson-Koopmans method can be used to calculate A-basis values for n less than 299. Find
the value k
A
corresponding to the sample size n in Table 2-4. For an A-basis value that meets the
requirements of CMH-17-1G, there must be at least five batches represented in the data and at

October 20, 2023 NCP-RP-2008-004 Rev B
Page 26 of 104
least 55 data points. For a B-basis value, there must be at least three batches represented in the
data and at least 18 data points.
nr k
2 2 35.177
3 3 7.859
4 4 4.505
5 4 4.101
6 5 3.064
7 5 2.858
8 6 2.382
9 6 2.253
10 6 2.137
11 7 1.897
12 7 1.814
13 7 1.738
14 8 1.599
15 8 1.540
16 8 1.485
17 8 1.434
18 9 1.354
19 9 1.311
20 10 1.253
21 10 1.218
22 10 1.184
23 11 1.143
24 11 1.114
25 11 1.087
26 11 1.060
27 11 1.035
28 12 1.010
B-Basis Hanson-Koopmans Table
Table 2-3: B-Basis Hanson-Koopmans Table

October 20, 2023 NCP-RP-2008-004 Rev B
Page 27 of 104
nknknk
2 80.00380 38 1.79301 96 1.32324
3 16.91220 39 1.77546 98 1.31553
4 9.49579 40 1.75868 100 1.30806
5 6.89049 41 1.74260 105 1.29036
6 5.57681 42 1.72718 110 1.27392
7 4.78352 43 1.71239 115 1.25859
8 4.25011 44 1.69817 120 1.24425
9 3.86502 45 1.68449 125 1.23080
10 3.57267 46 1.67132 130 1.21814
11 3.34227 47 1.65862 135 1.20620
12 3.15540 48 1.64638 140 1.19491
13 3.00033 49 1.63456 145 1.18421
14 2.86924 50 1.62313 150 1.17406
15 2.75672 52 1.60139 155 1.16440
16 2.65889 54 1.58101 160 1.15519
17 2.57290 56 1.56184 165 1.14640
18 2.49660 58 1.54377 170 1.13801
19 2.42833 60 1.52670 175 1.12997
20 2.36683 62 1.51053 180 1.12226
21 2.31106 64 1.49520 185 1.11486
22 2.26020 66 1.48063 190 1.10776
23 2.21359 68 1.46675 195 1.10092
24 2.17067 70 1.45352 200 1.09434
25 2.13100 72 1.44089 205 1.08799
26 2.09419 74 1.42881 210 1.08187
27 2.05991 76 1.41724 215 1.07595
28 2.02790 78 1.40614 220 1.07024
29 1.99791 80 1.39549 225 1.06471
30 1.96975 82 1.38525 230 1.05935
31 1.94324 84 1.37541 235 1.05417
32 1.91822 86 1.36592 240 1.04914
33 1.89457 88 1.35678 245 1.04426
34 1.87215 90 1.34796 250 1.03952
35 1.85088 92 1.33944 275 1.01773
36 1.83065 94 1.33120 299 1.00000
37 1.81139
A-Basis Hanson-Koopmans Table
Table 2-4: A-Basis Hanson-Koopmans Table
2.2.5 Analysis of Variance (ANOVA) Basis Values
ANOVA is used to compute basis values when the batch to batch variability of the data does not
pass the ADK test. Since ANOVA makes the assumption that the different batches have equal
variances, the data is checked to make sure the assumption is valid. Levene’s test for equality of
variance is used (see section 2.1.8). If the dataset fails Levene’s test, the basis values computed
are likely to be conservative. Thus this method can still be used but the values produced will be
listed as estimates.
2.2.5.1 Calculation of basis values using ANOVA
October 20, 2023 NCP-RP-2008-004 Rev B
Page 28 of 104
The following calculations address batch-to-batch variability. In other words, the only grouping
is due to batches and the k-sample Anderson-Darling test (Section 2.1.6) indicates that the batch
to batch variability is too large to pool the data. The method is based on the one-way analysis of
variance random-effects model, and the procedure is documented in reference 11.
ANOVA separates the total variation (called the sum of squares) of the data into two sources:
between batch variation and within batch variation.
First, statistics are computed for each batch, which are indicated with a subscript
2
,,
iii
nxs
while statistics that were computed with the entire dataset do not have a subscript. Individual
data values are represented with a double subscript, the first number indicated the batch and the
second distinguishing between the individual data values within the batch.
k stands for the
number of batches in the analysis. With these statistics, the Sum of Squares Between batches
(SSB) and the Total Sum of Squares (SST) are computed:
22
1
k
iI
i
SSB n x nx
Equation 52
22
11
i
n
k
ij
ij
SST x nx
Equation 53
The within-batch, or error, sum of squares (SSE) is computed by subtraction
SSE = SST − SSB Equation 54
Next, the mean sums of squares are computed:
1
SSB
MSB
k
Equation 55
SSE
MSE
nk
Equation 56
Since the batches need not have equal numbers of specimens, an ‘effective batch size,’ is defined
as
2
1
1
1
k
i
n
i
nn
n
k
Equation 57
Using the two mean squares and the effective batch size, an estimate of the population standard
deviation is computed:
1MSB n
SMSE
nn
Equation 58
Two k-factors are computed using the methodology of section 2.2.2 using a sample size of n
(denoted k
0
) and a sample size of k (denoted k
1
). Whether this value is an A- or B-basis value
depends only on whether k
0
and k
1
are computed for A or B-basis values.
October 20, 2023 NCP-RP-2008-004 Rev B
Page 29 of 104
Denote the ratio of mean squares by
M
SB
u
M
SE
Equation 59
If u is less than one, it is set equal to one. The tolerance limit factor is
1
010
1
1
1
ku
kkk
un
n
T
n
Equation 60
The basis value is
x
TS .
The ANOVA method can produce extremely conservative basis values when a small number of
batches are available. Therefore, when less than five (5) batches are available and the ANOVA
method is used, the basis values produced will be listed as estimates.
2.3 Single Batch and Two Batch estimates using modified CV
This method has not been approved for use by the CMH-17 organization. Values computed in
this manner are estimates only. It is used only when fewer than three batchs are available and no
valid B-basis value could be computed using any other method. The estimate is made using the
mean of the data and setting the coefficient of variation to 8 percent if it was less than that. A
modified standard deviation (S
adj
) was computed by multiplying the mean by 0.08 and
computing the A and B-basis values using this inflated value for the standard deviation.
Estimated B-Basis = 0.08
badj b
X
kS X k X Equation 61
2.4 Lamina Variability Method (LVM)
This method has not been approved for use by the CMH-17 organization. Values computed in
this manner are estimates only. It is used only when the sample size is less than 16 and no valid
B-basis value could be computed using any other method. The prime assumption for applying
the LVM is that the intrinsic strength variability of the laminate (small) dataset is no greater than
the strength variability of the lamina (large) dataset. This assumption was tested and found to be
reasonable for composite materials as documented by Tomblin and Seneviratne [13].
To compute the estimate, the coefficients of variation (CVs) of laminate data are paired with
lamina CV’s for the same loading condition and environmental condition. For example, the 0º
compression lamina CV CTD condition is used with open hole compression CTD condition.
Bearing and in-plane shear laminate CV’s are paired with 0º compression lamina CV’s.
However, if the laminate CV is larger than the corresponding lamina CV, the larger laminate CV
value is used.
The LVM B-basis value is then computed as:

October 20, 2023 NCP-RP-2008-004 Rev B
Page 30 of 104
LVM Estimated B-Basis =
12
1112
,
max ,
NN
X
KX CVCV Equation 62
When used in conjunction with the modified CV approach, a minimum value of 8% is used for
the CV.
Mod CV LVM Estimated B-Basis =
12
11 12
,
8%, ,
NN
X
KXMaxCVCV Equation 63
With:
1
X
the mean of the laminate (small dataset)
N
1
the sample size of the laminate (small dataset)
N
2
the sample size of the lamina (large dataset)
CV
1
is the coefficient of variation of the laminate (small dataset)
CV
2
is the coefficient of variation of the lamina (large dataset)
12
,NN
K is given in Table 2-5
23456789101112131415
2
00000000000000
3
4.5080000000000000
4
3.8273.607000000000000
5
3.4813.2633.14100000000000
6
3.2733.0562.9342.8540000000000
7
3.1342.9182.7962.7152.658000000000
8
3.0352.8202.6972.6162.5582.51500000000
9
2.9602.7462.6232.5412.4832.4402.4050000000
10
2.9032.6882.5652.4842.4252.3812.3462.318000000
11
2.8562.6432.5192.4372.3782.3342.2992.2702.24700000
12
2.8192.6052.4812.3992.3402.2952.2602.2312.2072.1870000
13
2.7872.5742.4502.3672.3082.2632.2272.1982.1742.1542.137000
14
2.761 2.547 2.423 2.341 2.281 2.236 2.200 2.171 2.147 2.126 2.109 2.093 0 0
15
2.738 2.525 2.401 2.318 2.258 2.212 2.176 2.147 2.123 2.102 2.084 2.069 2.056 0
16
2.719 2.505 2.381 2.298 2.238 2.192 2.156 2.126 2.102 2.081 2.063 2.048 2.034 2.022
17
2.701 2.488 2.364 2.280 2.220 2.174 2.138 2.108 2.083 2.062 2.045 2.029 2.015 2.003
18
2.686 2.473 2.348 2.265 2.204 2.158 2.122 2.092 2.067 2.046 2.028 2.012 1.999 1.986
19
2.673 2.459 2.335 2.251 2.191 2.144 2.108 2.078 2.053 2.032 2.013 1.998 1.984 1.971
20
2.661 2.447 2.323 2.239 2.178 2.132 2.095 2.065 2.040 2.019 2.000 1.984 1.970 1.958
21
2.650 2.437 2.312 2.228 2.167 2.121 2.084 2.053 2.028 2.007 1.988 1.972 1.958 1.946
22
2.640 2.427 2.302 2.218 2.157 2.110 2.073 2.043 2.018 1.996 1.978 1.962 1.947 1.935
23
2.631 2.418 2.293 2.209 2.148 2.101 2.064 2.033 2.008 1.987 1.968 1.952 1.938 1.925
24
2.623 2.410 2.285 2.201 2.139 2.092 2.055 2.025 1.999 1.978 1.959 1.943 1.928 1.916
25
2.616 2.402 2.277 2.193 2.132 2.085 2.047 2.017 1.991 1.969 1.951 1.934 1.920 1.907
26
2.609 2.396 2.270 2.186 2.125 2.078 2.040 2.009 1.984 1.962 1.943 1.927 1.912 1.900
27
2.602 2.389 2.264 2.180 2.118 2.071 2.033 2.003 1.977 1.955 1.936 1.920 1.905 1.892
28
2.597 2.383 2.258 2.174 2.112 2.065 2.027 1.996 1.971 1.949 1.930 1.913 1.899 1.886
29
2.591 2.378 2.252 2.168 2.106 2.059 2.021 1.990 1.965 1.943 1.924 1.907 1.893 1.880
30
2.586 2.373 2.247 2.163 2.101 2.054 2.016 1.985 1.959 1.937 1.918 1.901 1.887 1.874
40
2.550 2.337 2.211 2.126 2.063 2.015 1.977 1.946 1.919 1.897 1.877 1.860 1.845 1.832
50
2.528 2.315 2.189 2.104 2.041 1.993 1.954 1.922 1.896 1.873 1.853 1.836 1.820 1.807
60
2.514 2.301 2.175 2.089 2.026 1.978 1.939 1.907 1.880 1.857 1.837 1.819 1.804 1.790
70
2.504 2.291 2.164 2.079 2.016 1.967 1.928 1.896 1.869 1.846 1.825 1.808 1.792 1.778
80
2.496 2.283 2.157 2.071 2.008 1.959 1.920 1.887 1.860 1.837 1.817 1.799 1.783 1.769
90
2.491 2.277 2.151 2.065 2.002 1.953 1.913 1.881 1.854 1.830 1.810 1.792 1.776 1.762
100
2.486 2.273 2.146 2.060 1.997 1.948 1.908 1.876 1.849 1.825 1.805 1.787 1.771 1.757
125
2.478 2.264 2.138 2.051 1.988 1.939 1.899 1.867 1.839 1.816 1.795 1.777 1.761 1.747
150
2.472 2.259 2.132 2.046 1.982 1.933 1.893 1.861 1.833 1.809 1.789 1.770 1.7
54 1.740
175
2.468 2.255 2.128 2.042 1.978 1.929 1.889 1.856 1.828 1.805 1.784 1.766 1.750 1.735
200
2.465 2.252 2.125 2.039 1.975 1.925 1.886 1.853 1.825 1.801 1.781 1.762 1.746 1.732
N1
N1+N2-2
Table 2-5: B-Basis factors for small datasets using variability of corresponding large dataset

October 20, 2023 NCP-RP-2008-004 Rev B
Page 31 of 104
2.5 0º Lamina Strength Derivation
Lamina strength values in the 0º direction were not obtained directly for any conditions during
compression tests. They are derived from the cross-ply lamina test results using a back out
formula. Unless stated otherwise, the 0° lamina strength values were derived using the
following formula:
00/90
uu
F
FBF
where BF is the backout factor.
0/90
=UNC0 or UNT0 strength values
u
F
2
102 0 1 122
2
01 0 2 0 2 0 1 12 2
1
11
EVE V E E
BF
VE V E VE V E E
Equation 64
V
0
=fraction of 0º plies in the cross-ply laminate ( ½ for UNT0 and 1/3 for UNC0)
E
1
= Average across of batches of modulus for LC and LT as appropriate
E
2
= Average across of batches of modulus for TC and TT as appropriate
ν
12
= major Poisson’s ratio of 0º plies from an average of all batches
This formula can also be found in section 2.4.2, equation 2.4.2.1(b) of CMH-17-1G.
In computing these strength values, the values for each environment are computed separately.
The compression values are computed using only compression data, the tension values are
computed using only tension data. Both normalized and as measured computations are done
using the as measured and normalized strength values from the UNC0 and UNT0 strength
values.
2.5.1 0º Lamina Strength Derivation (Alternate Formula)
In some cases, the previous formula cannot be used. For example, if there were no ETD tests run
for transverse tension and compression, the value for E
2
would not be available. In that case, this
alternative formula is used to compute the strength values for longitudinal tension and
compression. It is similar to, but not quite the same as the formula detailed above. It requires the
UNC0 and UNT0 strength and modulus data in addition to the LC and LT modulus data.
The 0° lamina strength values for the LC ETD condition were derived using the formula:
11
00/90 00/90
0/90 0/90
,
ct
cu cu tu tu
ct
EE
FF FF
EE
Equation 65
with
00
,
cu tu
F
F
the derived mean lamina strength value for compression and tension respectively
0/90 0/90
,
cu tu
FF
are the mean strength values for UNC0 and UNT0 respectively
11
,
ct
EE are the modulus values for LC and LT respectively
0/90 0/90
,
ct
EE
are the modulus values for UNC0 and UNT0 respectively
This formula can also be found in section 2.4.2, equation 2.4.2.1(d) of CMH-17-1G.
October 20, 2023 NCP-RP-2008-004 Rev B
Page 32 of 104
3. Summary of Results
The basis values for all tests are summarized in the following tables. The NCAMP recommended
B-basis values meet all requirements of CMH-17-1G. However, not all test data meets those
requirements. The summary tables provide a complete listing of all computed basis values and
estimates of basis values. Data that does not meet the requirements of CMH-17-1G are shown in
shaded boxes and labeled as estimates. Basis values computed with the modified coefficient of
variation (CV) are presented whenever possible. Basis values and estimates computed without
that modification are presented for all tests.
3.1 NCAMP Recommended B-basis Values
The following rules are used in determining what B-basis value, if any, is included in tables
Table 3-1and Table 3-2 of recommended values.
1.
Recommended values are NEVER estimates. Only B-basis values that meet all
requirements of CMH-17-1G are recommended.
2.
Modified CV basis values are preferred. Recommended values will be the modified
CV basis value when available. The CV provided with the recommended basis value
will be the one used in the computation of the basis value.
3.
Only normalized basis values are given for properties that are normalized.
4.
ANOVA B-basis values are not recommended since only three batches of material are
available and CMH-17-1G recommends that no less than five batches be used when
computing basis values with the ANOVA method.
5.
Basis values of 90% or more of the mean value imply that the CV is unusually low
and may not be conservative. Caution is recommended with B-Basis values calculated
from STAT-17 when the B-basis value is 90% or more of the average value. Such
values will be indicated.
6.
If the data appear questionable (e.g. when the CTD-RTD-ETW trend of the basis
values are not consistent with the CTD-RTD-ETW trend of the average values), then
the B-basis values will not be recommended.
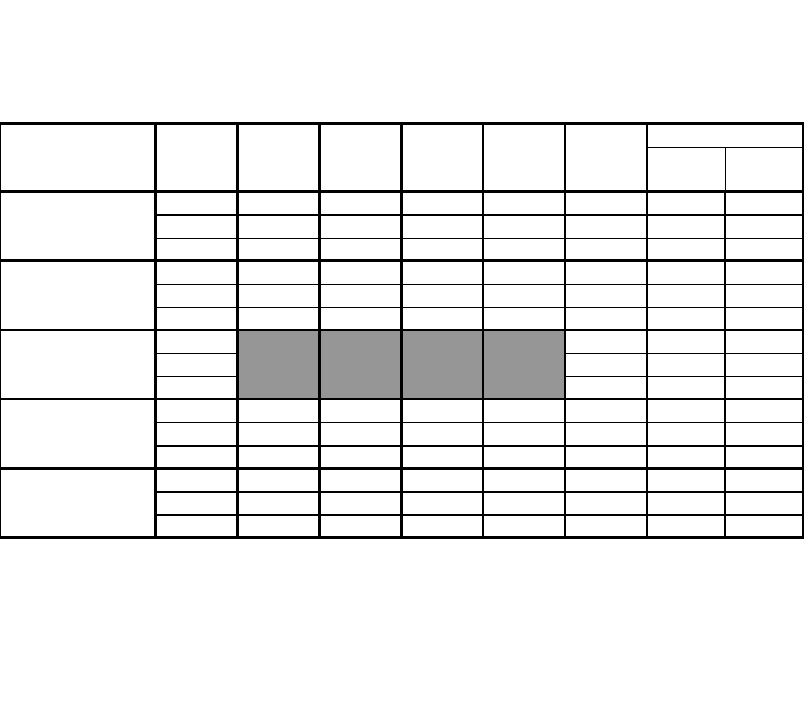
October 20, 2023 NCP-RP-2008-004 Rev B
Page 33 of 104
Lamina Strength Tests
0.2%
Offset
5%
Strain
B-basis 232.65 207.81 NA: A 33.04 14.41 7.61 12.17
Mean 263.10 231.81 7.10 38.35 16.35 8.36 13.37
CV 6.99 7.02 14.77 7.00 6.00 6.00 6.00
B-basis 240.01 178.99 NA: A 24.26** 11.16 5.56 8.64
Mean 270.76 202.80 6.92 26.81 12.66 6.31 9.83
CV 6.64 7.68 17.47 4.93 6.00 6.00 6.00
B-basis 8.70 NA:I NA:I
Mean 9.87 4.91 7.28
CV 6.00 1.68 1.07
B-basis 225.78 111.93 NA: A 13.15 7.32 3.71 5.44
Mean 256.69 135.73 3.99 14.96 8.31 4.16 6.11
CV 7.04 8.49 9.85 6.13 6.00 6.00 6.00
B-basis 237.12 114.32 NA: A 10.90 5.96 2.89 NA:I
Mean 268.04 138.12 3.26 12.30 6.83 3.24 4.79
CV 6.13 9.44 13.32 6.16 6.45 6.00 6.00
Notes: The modified CV B-basis value is recommended when available.
The CV provided corresponds with the B-basis value given.
NA implies that tests were run but data did not meet NCAMP recommended requirements.
"NA: A" indicates ANOVA with 3 batches, "NA: I" indicates insufficient data,
Shaded empty boxes indicate that no test data is available for that property and condition.
* Data is as measured rather than normalized
** indicates the Stat17 B-basis value is greater than 90% of the mean value.
TT* TC*
IPS*
NCAMP Recommended B-basis Values for
All B-basis values in this table meet the standards for publication in CMH-17-1G Handbook
ACG - MTM45-1/AS4-145-32% RW Unidirectional
V
alues are for normalized data unless otherwise noted
Environment
CTD (-65°F)
RTD (75°F)
ETD (200°F)
Statistic LT LC
ETW (200°F)
ETW2 (250°F)
SBS*
Table 3-1 : NCAMP recommended B-basis values for lamina test data
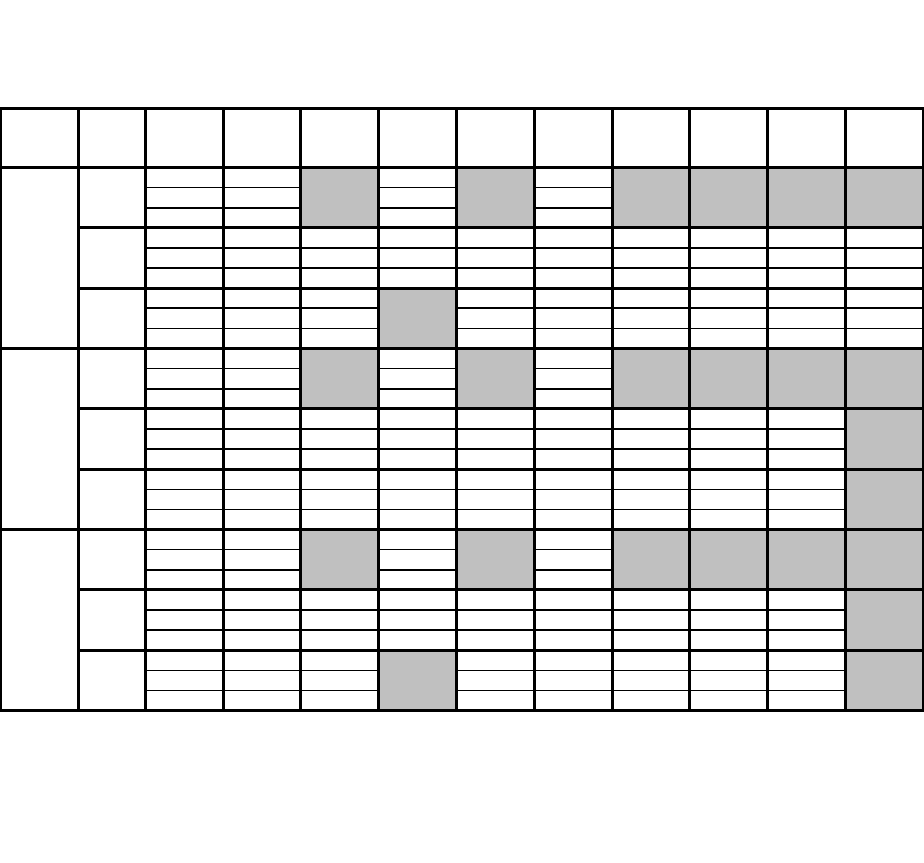
October 20, 2023 NCP-RP-2008-004 Rev B
Page 34 of 104
Laminate Strength Tests
B-basis 51.52 51.76 101.08
Mean 57.49 58.71 113.13
CV 6.00 6.00 6.00
B-basis 51.42 39.31 NA:I NA:I 97.66 70.43 76.95 115.39 NA: A
Mean 57.39 43.76 60.67 65.06 109.54 78.28 93.03 127.63 10.28
CV 6.00 6.28 1.77 1.75 6.05 7.08 8.75 6.00 8.56
B-basis 48.99 30.12 38.72 NA:I 49.12 67.13 83.12 4.70
Mean 54.96 34.57 45.13 99.38 56.84 77.77 95.19 5.34
CV 6.00 6.37 7.28 5.87 6.26 7.18 6.21 6.00
B-basis NA: A NA:I NA:I
Mean 43.22 44.88 69.62
CV 4.96 0.96 3.71
B-basis NA:I NA:I NA:I NA:I NA:I NA:I NA:I NA:I
Mean 41.06 36.32 42.28 48.80 64.02 56.30 63.08 111.37
CV 0.91 2.53 2.52 4.69 2.76 7.83 6.49 3.41
B-basis NA:I 24.07 NA:I 31.22 NA:I NA:I 66.17 81.84
Mean 34.93 27.31 35.87 35.42 47.37 44.27 75.04 92.78
CV 1.40 6.00 0.59 6.00 2.57 4.06 6.38 6.36
B-basis 78.08 NA:I NA:I
Mean 90.56 94.15 158.29
CV 6.98 4.50 4.82
B-basis NA:I NA:I NA:I NA:I NA:I NA:I NA:I NA:I
Mean 93.57 56.05 90.20 83.49 161.63 95.48 68.40 107.16
CV 3.77 6.87 4.38 3.28 4.48 2.31 13.81 3.91
B-basis NA:I 40.53 46.41 NA:I NA:I 57.35 82.18
Mean 96.13 46.06 56.83 148.41 65.89 74.88 92.69
CV 2.49 6.09 9.62 2.29 5.36 7.43 6.06
Notes: The modified CV B-basis value is recommended when available.
The CV provided corresponds with the B-basis value given.
NA implies that tests were run but data did not meet NCAMP recommended requirements.
"NA: A" indicates ANOVA with 3 batches, "NA: I" indicates insufficient data,
Shaded empty boxes indicate that no test data is available for that property and condition.
* Data is as measured rather than normalized
** indicates the Stat17 B-basis value is greater than 90% of the mean value.
NCAMP Recommended B-basis Values for
ACG - MTM45-1/AS4-145-32%RW Unidirectional
All B-basis values in this table meet the standards for publication in CMH-17-1G Handbook
Statistic OHT OHC FHT
Values are for normalized data unless otherwise noted
UNC
PB
2% Offset
PB
Ult. Str.
LSBS*
"Quasi-Isotropic" 25/50/2
5
CTD
(-65°F)
RTD
(75°F)
ETW2
(250°F)
FHC UNT
"Soft" 10/80/10
CTD
(-65°F)
RTD
(75°F)
ETW2
(250°F)
"Hard" 50/40/10
CTD
(-65°F)
RTD
(75°F)
ETW2
(250°F)
Lay-up ENV
Table 3-2 : NCAMP Recommended B-basis values for laminate test data
October 20, 2023 NCP-RP-2008-004 Rev B
Page 35 of 104
3.2 Lamina and Laminate Summary Tables
Advanced Composites Group - MTM45-1 12K AS4-145 Unidirectional Tape
NMS 451/11 Material Specification
NPS 81451 Process Specification "MH" Cure Cycle
Fabric:
Hexcel AS4-GP Fiber 12K tow
Resin:
MTM45-1
Tg(dry):
397.33°F
Tg(wet):
339.46°F
Tg METHOD:
SACMA SRM 18R-94
Date of fiber manufacture 8/18/2005; 12/7/2005 3/2/2022 to 10/5/2022 Date of testing 8/2/2006 to 6/26/2007 7/25/2023 to 8/31/2023
Date of resin manufacture 12/6/2005 to 1/10/2006 5/31/2022 to 1/16/2023 Date of data submittal 7/1/2007
Date of prepreg manufacture 12/6/2005 to 1/10/2006 6/8/2022 to 3/27/2023 Date of Analysis 7/18/2008 to 2/04/2011
Date of composite manufacture 2/22/2006 to 7/7/2006 5/3/2023 to 5/16/2023
P
roper
t
y
Test
B-Basis
Modified CV
B-basis
Mean B-Basis
Modified CV
B-basis
Mean B-Basis
Modified CV
B-basis
Mean B-Basis
Modified CV
B-basis
Mean B-Basis
Modified CV
B-basis
Mean
F
1
cu
211.95 209.91 233.19 182.47 180.44 203.53 115.15 113.12 136.21 117.40 115.37 138.46
(ksi)
(209.10) (207.81) (231.81) (180.27) (178.99) (202.80) (113.21) (111.93) (135.73) (115.60) (114.32) (138.12)
*E
1
c
17.07 17.06 17.31 19.82
(Msi)
(16.83) (17.02) (17.24) (19.63)
*ν
12
c
0.30 0.31 0.32 0.35
F
1
tu
242.93 236.44 266.77 250.71 244.16 274.78 233.42 226.83 257.63 246.95 240.36 271.16
(ksi)
(238.38) (232.65) (263.10) (245.79) (240.01) (270.76) (231.59) (225.78) (256.69) (242.94) (237.12) (268.04)
*E
1
t
18.96 18.79 18.74 22.21
(Msi)
(18.74) (18.51) (18.66) (21.90)
F
2
cu
(ksi)
33.80 33.04 38.35 24.26 NA 26.81 12.46 13.15 14.96 11.32 10.90 12.30
*E
2
c
(Msi)
1.42 1.25 1.18 1.27
*ν
21
c
0.018 0.015 0.014 0.054
F
2
tu
(ksi)
1.24 5.03 7.10 0.48 4.53 6.92 2.11 3.24 3.99 0.66 2.40 3.26
*E
2
t
(Msi)
1.25 1.15 0.99 0.94
UNC0 Strength
113.47 112.40 124.54 97.09 96.03 108.07 83.72 82.66 94.70 64.84 63.78 75.82 59.02 57.96 70.00
(ksi)
(112.63) (111.61) (123.72) (96.57) (95.56) (107.57) (83.40) (82.39) (94.40) (65.18) (64.17) (76.18) (59.05) (58.03) (70.05)
*UNC0 Modulus
9.12 9.06 9.50 9.64 10.02
(Msi)
(9.06) (9.01) (9.48) (9.68) (9.99)
* UNC0
Poisson's Ratio
0.039 0.034 0.031 0.034 0.058
UNT0 Strength
128.26 124.97 140.73 131.16 127.83 143.74 125.11 121.77 137.77 118.93 115.59 131.59
(ksi)
(129.51) (125.75) (141.41) (132.67) (128.88) (144.69) (127.46) (123.64) (139.54) (121.65) (117.84) (133.73)
*UNT0 Modulus
10.00 9.83 10.02 10.78
(Msi)
(10.07) (9.90) (10.15) (10.98)
F
12
s5%strain
(ksi)
12.20 12.17 13.37 9.39 8.64 9.83 7.13 6.40 7.28 5.91 5.44 6.11 4.59 4.27 4.79
F
12
s0.2%
(ksi)
8.10 7.61 8.36 5.88 5.56 6.31 4.74 4.31 4.91 4.03 3.71 4.16 3.10 2.89 3.24
G
12
s
(Msi)
0.69 0.57 0.46 0.43 0.34
SBS (ksi)
15.09 14.41 16.35 10.38 11.16 12.66 9.50 8.70 9.87 6.69 7.32 8.31 4.73 5.96 6.83
F
1
cu
and F
1
tu
are derived from cross-ply laminates per AI/TR/1392 Table 3a, note (1).
*Strain data acquisition equipment calibrated by internal shunt method. Calibration traceable to NIST standard not available.
Data reported: As-measured with normalized values in parentheses, normalizing tply: 0.0055 inches
ETW2 (250°F)ETD (200°F) ETW (200°F)CTD (-65°F) RTD (75°F)
Values shown in shaded boxes do not meet CMH-17-1G requirements and are estimates only
These values may not be used for certification unless specifically allowed by the certifying agency
Process Specification:
Material Specificaton:
Material:
LAMINA MECHANICAL PROPERTY B-BASIS SUMMARY
9/21/2023
9/15/2023
IPS retest
IPS retest
ACG - MTM45-1/AS4-145-32%RW
Lamina Properties Summary
Table 3-3: Summary of Test Results for Lamina Data
October 20, 2023 NCP-RP-2008-004 Rev B
Page 36 of 104
Advanced Composites Group - MTM45-1 12K AS4-145 Unidirectional Tape
NMS 451/11 Material Specification
NPS 81451 Process Specification "MH" Cure Cycle
Fabric:
Hexcel AS4-GP Fiber 12K tow
Resin:
MTM45-1
Tg(dry):
397.33°F
Tg(wet):
339.46°F
Tg METHOD:
SACMA SRM 18R-94
Date of fiber manufacture
8/18/2005; 12/7/2005
Date of testing
Date of re sin manufacture
12/6/2005 to 1/10/2006
Date of data submittal
Date of prepreg manufacture
12/6/2005 to 1/10/2006
Date of Analysis
Date of composite manufacture
2/22/2006 to 7/7/2006
Layup:
Test
Condition
B-value
Mod. CV
B-value
Mean B-value
Mod. CV
B-value
Mean B- v alu e
Mod. CV
B-value
Mean
CTD (-65
°
F)
54.51 51.52 57.49 28.71 NA 43.22 62.46 78.08 90.56
RTD (75
°
F) 51.36 51.42 57.39 36.41 34.00 41.06 82.97 77.49 93.57
ETW (200
°
F) 47.79 48.13 55.01 --- --- --- --- --- ---
ETW2 (250
°
F)
51.82 48.99 54.96 31.73 28.91 34.93 87.31 79.54 96.13
RTD (75°F)
32.15 39.31 43.76 30.67 30.18 36.32 47.55 46.82 56.05
ETW (200°F) 31.18 32.89 37.99 --- --- --- --- --- ---
ETW2 (250°F)
26.23 30.12 34.57 25.52 24.07 27.31 42.26 40.53 46.06
Strength (ksi) 105.69 101.08 113.13 60.74 57.74 69.62 138.10 131.29 158.29
* Modulus (Msi)
--- --- 7.30 --- --- 4.62 --- --- 11.34
Strength (ksi) 102.20 97.66 109.54 56.77 53.02 64.02 144.17 135.16 161.63
* Modulus (Msi)
--- --- 7.00 --- --- 4.35 --- --- 10.82
Strength (ksi) 90.84 85.54 99.38 43.02 39.20 47.37 134.78 122.80 148.41
* Modulus (Msi)
--- --- 8.53 --- --- 4.79 --- --- 12.95
Strength (ksi)
59.57 70.43 78.28 46.98 46.78 56.30 80.63 79.35 95.48
* Modulus (Msi) --- --- 6.29 --- --- 4.06 --- --- 9.78
* Poisson's Ratio --- --- 0.2958 --- --- 0.5413 --- --- 0.3890
Strength (ksi)
53.00 55.21 63.94 --- --- --- --- --- ---
* Modulus (Msi) --- --- 6.86 --- --- --- --- --- ---
* Poisson's Ratio
--- --- 0.35 --- --- --- --- --- ---
Strength (ksi) 52.08 49.12 56.84 35.44 NA 44.27 53.35 NA 65.89
* Modulus (Msi)
--- --- 6.99 --- --- 4.20 --- --- 11.13
* Poisson's Ratio
--- --- 0.36 --- --- 0.56 --- --- 0.42
CTD (-65°F) 55.16 51.76 58.71 39.16 37.23 44.88 82.15 78.09 94.15
RTD (75°F) 53.80 50.25 60.67 37.49 35.01 42.28 79.98 74.70 90.20
ETW2 (250°F)
--- --- ---
32.58 29.68 35.87 --- --- ---
RTD (75°F)
54.94 54.07 65.06 41.21 40.55 48.80 70.50 69.38 83.49
ETW2 (250°F)
39.36 38.72 45.13 32.72 31.22 35.42 46.41 NA 56.83
RTD (75°F) 5.40 8.54 10.28 --- --- --- --- --- ---
ETW (200°F) 5.41 5.40 6.50 --- --- --- --- --- ---
ETW2 (250°F)
4.96 4.70 5.34 --- --- --- --- --- ---
RTD (75°F)
76.95 NA 93.03 53.27 52.42 63.08 48.45 NA 68.40
ETW2 (250°F)
68.34 67.13 77.77 68.43 66.17 75.04 57.35 NA 74.88
RTD (75°F) 104.16 115.39 127.63 94.04 92.55 111.37 90.49 89.06 107.16
ETW2 (250°F)
87.20 83.12 95.19 84.66 81.84 92.78 85.54 82.18 92.69
RTD (75°F)
--- --- 6.891 --- --- --- --- --- ---
ETW2 (250°F) --- --- 3.895 --- --- --- --- --- ---
RTD (75°F)
--- --- 287.34 --- --- --- --- --- ---
ETW2 (250°F) --- --- 163.19 --- --- --- --- --- ---
Strength (ksi)
--- --- 31.09 --- --- --- --- --- ---
*Modulus (Msi)
--- --- 7.010 --- --- --- --- --- ---
* Strain data acquisition equipment calibrated by internal shunt m ethod. Calibration traceable to NIST standard not available
Material:
Mate rial Specifica ton:
Process Specification:
RTD (75°F)
ETW (200°F)
ETW2 (250°F)
RTD (75°F)
CTD (-65°F)
Values shown in shaded boxes do not meet CMH-17-1G requirements and are estimates only
These values may not be used for certification unless specifically allowed by the certifying agency
8/2/2006 to 6/26/2007
7/1/2007
FHC
(normalized)
7/18/2008 to 2/04/2011
UNC
(normalized)
LAMINATE MECHANICAL PROPERTY SUMMARY for MTM45-1/AS4-145-32%RW UNI
Test
OHT
(normalized)
OHC
(normalized)
UNT
(normalized)
Data reported as normalized used a normalizing t
ply
of 0.0055 inches
Strength (ksi)
"Hard" 50/40/10
Property
"Quasi Isotropic" 25/50/25
Strength (ksi)
"Soft" 10/80/10
RTD (75°F)
Strength (ksi)
Strength (ksi)
Strength (ksi)
ETW2 (250°F)
Strength (in-lb/in)
Strength (ksi)
CAI
(normalized)
Ultim ate
Strength (ksi)
Pin Bearing
(normalized)
ILT
(as-measured)
FHT
(normalized)
LSBS
(as-measured)
2% Offs et
Strength (ksi)
CBS
(as-measured)
ACG MTM45-1/AS4-145-
32%RW
Laminate Properties
Summary
Table 3-4: Summary of Test Results for Laminate Data
October 20, 2023 NCP-RP-2008-004 Rev B
Page 37 of 104
4. Lamina Test Results, Statistics, Basis Values and Graphs
Test data for fiber dominated properties was normalized according to nominal cured ply
thickness. Both normalized and as measured statistics were included in the tables, but only the
normalized data values were graphed. Test failures, outliers and explanations regarding
computational choices were noted in the accompanying text for each test.
All individual specimen results are graphed for each test by batch and environmental condition
with a line indicating the recommended basis values for each environmental condition. The data
is jittered (moved slightly to the left or right) in order for all specimen values to be clearly
visible. The strength values are always graphed on the vertical axis with the scale adjusted to
include all data values and their corresponding basis values. The vertical axis may not include
zero. The horizontal axis values will vary depending on the data and how much overlapping of
there was of the data within and between batches. When there was little variation, the batches
were graphed from left to right and the environmental conditions were identified by the shape
and color of the symbol used to plot the data. Otherwise, the environmental conditions were
graphed from left to right and the batches were identified by the shape and color of the symbol.
When a dataset fails the Anderson-Darling k-sample (ADK) test for batch-to-batch variation an
ANOVA analysis is required. In order for B-basis values computed using the ANOVA method,
data from five batches is required. Since this qualification dataset has only three batches, the
basis values computed using ANOVA are considered estimates only. However, the basis values
resulting from the ANOVA method using only three batches may be overly conservative. The
ADK test is performed again after a transformation of the data according to the assumptions of
the modified CV method (see section 2.1.4 for details). If the dataset still passes the ADK test at
this point, modified CV basis values are provided. If the dataset does not pass the ADK test after
the transformation, estimates may be computed using the modified CV method per the guidelines
in CMH-17-1G section 8.3.10.
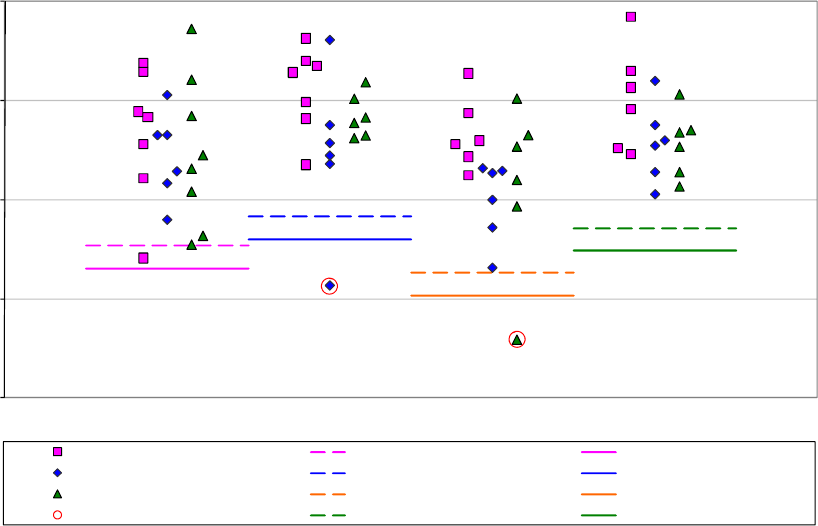
October 20, 2023 NCP-RP-2008-004 Rev B
Page 38 of 104
4.1 Longitudinal (0º) Tension Properties (LT)
The normalized LT data meets all CMH-17-1G requirements for B-basis values. The LT data
met all requirements for pooling across all environments.
The as measured LT data could also be pooled across all environments. While the CTD and
RTD environments failed the normality test, the pooled dataset passed.
There were four outliers in the LT data. There was one outlier in the RTD condition data. It was
an outlier for both the as measured and normalized data. It was on the low side of batch two and
was an outlier for the RTD condition but not for batch two. There were two outliers in the ETW
condition data. One outlier was on the high side of batch two for the as measured data only. It
was an outlier for batch two, but not for the ETW condition. The second outlier in the ETW data
was on the low side of batch three. It was an outlier for both the normalized and as measured
data. It was an outlier for the ETW condition, but not for batch three. The fourth outlier in the
LT data was in the ETW2 condition. It was an outlier only for the as measured data. It was on
the low side of batch two and was an outlier for both batch two and the ETW2 condition. All
outliers were retained for this analysis.
Statistics and basis values are given for the LT strength data in Table 4-1. Statistics for the
modulus data are given in Table 4-2. The normalized data and the B-basis values are shown
graphically in Figure 4-1.
200
225
250
275
300
ksi
CTD RTD ETW ETW2
Environmental Conditions
ACG MTM45-1/AS4-145-32%RW UNI
Longitudinal Tension (LT) Strength Normalized
Batch 1 CTD B-basis (pooled) CTD B-basis (Mod CV)
Batch 2 RTD B-basis (pooled) RTD B-basis (Mod CV)
Batch 3 ETW B-basis (pooled) ETW B-basis (Mod CV)
Outlier ETW2 B-basis (pooled) ETW2 B-basis (Mod CV)
Figure 4-1: Batch Plot for LT Strength normalized

October 20, 2023 NCP-RP-2008-004 Rev B
Page 39 of 104
En v C T D RT D ET W ET W2 C T D RT D ET W ET W2
Mean 263.10 270.76 256.69 268.04 266.77 274.78 257.63 271.16
Stdev 15.74 14.28 15.61 11.41 17.56 14.87 11.43 9.57
CV 5.98 5.27 6.08 4.26 6.58 5.41 4.44 3.53
Mod CV 6.99 6.64 7.04 6.13 7.29 6.71 6.22 6.00
Min 235.33 228.30 214.72 251.32 229.34 226.92 224.77 243.03
Max 293.06 290.72 281.88 296.23 292.73 292.03 273.54 286.04
No. Batches33333333
No. Spec. 2119181821191818
B-basis Value 238.38 245.79 231.59 242.94 242.93 250.71 233.42 246.95
A-e stim ate 221.79 229.25 215.07 226.42 226.94 234.76 217.49 231.02
Method pooled pooled pooled pooled pooled pooled pooled pooled
B-basis Value 232.65 240.01 225.78 237.12 236.44 244.16 226.83 240.36
A-e stim ate 212.23 219.64 205.43 216.78 216.10 223.86 206.56 220.09
Method pooled pooled pooled pooled pooled pooled pooled pooled
Longitudinal Tension Strength (ksi)
Modified CV Basis Values and/or Estimates
Normalized As Measured
Basis Values and/or Estimates
Table 4-1: Statistics and Basis Values for LT Strength data
Env CTD RTD ETW ETW2 CTD RTD ETW ETW2
Mean 18.74 18.51 18.66 21.90 18.96 18.79 18.74 22.21
Stdev 0.78 0.62 0.61 1.12 0.76 0.56 0.70 1.16
CV 4.16 3.34 3.24 5.10 4.00 2.98 3.75 5.22
Mod CV 6.08 6.00 6.00 6.55 6.00 6.00 6.00 6.61
Min 17.55 17.53 17.54 19.51 17.43 18.20 17.87 19.70
Max 20.22 20.23 19.68 23.60 20.09 19.91 20.49 23.94
No. Batches33333333
No. Spec. 18 18 18 15 18 18 18 15
Longitudinal Tension Modulus (msi)
Normalized As Measured
Table 4-2: Statistics from LT modulus data
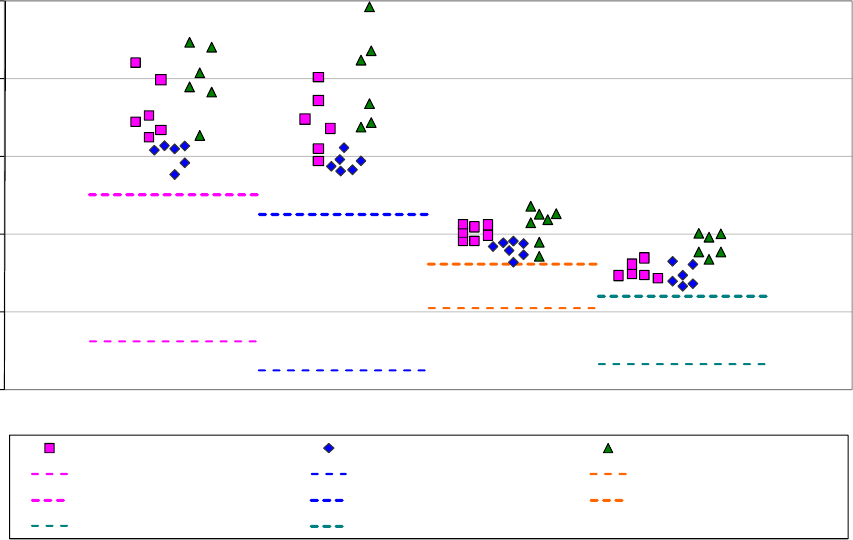
October 20, 2023 NCP-RP-2008-004 Rev B
Page 40 of 104
4.2 Transverse (90º) Tension Properties (TT)
Transverse Tension data is not normalized because it is not a fiber dominated property for
unidirectional tape. The strength data could not be pooled as all four conditions failed the ADK
test. In addition, all environments have such a large coefficient of variation that the modified
CV method would have no effect. This means those datasets require the ANOVA method and
with data from less than five batches available it is an estimate only and may result in overly
conservative basis values. An override of the ADK test results is not appropriate due to the
batches showing trends across the environments; batch two has lowest mean for all four
environments while batch three has the highest mean for all for environments. Estimates were
also computed using the normal distribution method, but caution is advised with these estimates.
There were no outliers.
Statistics and A- and B-estimates of basis values are given for the as measured TT strength and
modulus data in Table 4-3. The data and B-estimates are shown graphically in Figure 4-2.
0
2
4
6
8
10
ksi
CTD RTD ETW ETW2
Environmental Condition
ACG MTM45-1/AS4-145-32%RW UNI
Transverse Tension (TT) Strength as measured
Batch 1 Batch 2 Batch 3
CTD B-estimate (ANOVA) RTD B-estimate (ANOVA) ETW B-estimate (ANOVA)
CTD B-estimate (Normal) RTD B-estimate (Normal) ETW B-estimate (Normal)
ETW2 B-estimate (ANOVA) ETW2 B-estimate (Normal)
Figure 4-2: Batch Plot for TT Strength as measured

October 20, 2023 NCP-RP-2008-004 Rev B
Page 41 of 104
En v C T D RT D ET W ET W2 C T D RT D ET W ET W2
Mean 7.10 6.92 3.99 3.26 1.25 1.15 0.99 0.94
Stdev 1.05 1.21 0.39 0.43 0.13 0.04 0.07 0.10
CV 14.77 17.47 9.85 13.32 10.73 3.08 7.01 10.78
Mod CV 14.77 17.47 9.85 13.32 10.73 6.00 7.51 10.78
Min 5.54 5.63 3.29 2.68 1.08 1.10 0.89 0.80
Max 8.94 9.85 4.74 4.04 1.54 1.22 1.22 1.21
No. Batches33333333
No. Spec. 1818211817182015
B-es tim ate 1.24 0.48 2.11 0.66
A-e stim ate 0.00 0.00 0.77 0.00
Method ANOVA ANOVA ANOVA ANOVA
B-es tim ate 5.03 4.53 3.24 2.40
A-e stim ate 3.56 2.84 2.70 1.80
Method normal norm al norm al normal
Transverse Tension
Modulus (msi) as measuredStrength (ksi) as measured
Basis Values and/or Estimates
Estimates computed ignoring the ADK test results
Table 4-3: Statistics and Basis Values for TT Strength and Modulus data
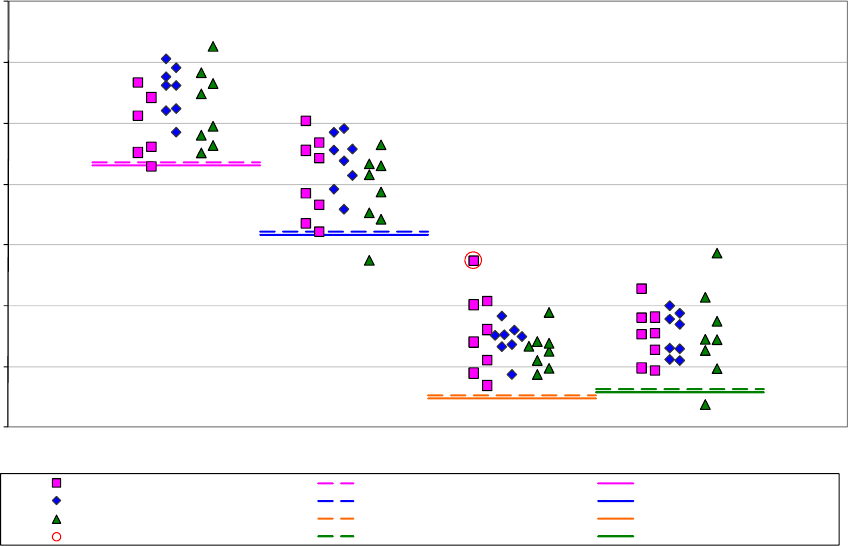
October 20, 2023 NCP-RP-2008-004 Rev B
Page 42 of 104
4.3 Longitudinal (0º) Compression Properties (LC)
This data meets all CMH-17-1G requirements for publication of the B-basis values. The LC data
met all requirements for pooling across all environments.
There was one outlier in batch one on the high side in the ETW environment. It was an outlier
for the LC condition, but not batch one. It was an outlier for both the normalized and as
measured data. This outlier was retained for this analysis.
Statistics and basis values are given for the LC strength data in Table 4-4. Statistics for the
modulus data are given in Table 4-5. The normalized data and B-basis values are shown
graphically in Figure 4-3.
100
125
150
175
200
225
250
275
ksi
CTD RTD ETW ETW2
Environmental Condition
ACG MTM45-1/AS4-145-32%RW UNI
Longitudinal Compression (LC) Strength Normalized
Batch 1 CTD B-basis (pooled) CTD B-basis (Mod CV)
Batch 2 RTD B-basis (pooled) RTD B-basis (Mod CV)
Batch 3 ETW B-basis (pooled) ETW B-basis (Mod CV)
Outlier ETW2 B-basis (pooled) ETW2 B-basis (Mod CV)
Figure 4-3: Batch Plot for LC Strength normalized

October 20, 2023 NCP-RP-2008-004 Rev B
Page 43 of 104
En v C TD RT D ET W ET W2 C T D RT D ET W ET W2
Me an 231.81 202.80 135.73 138.12 233.19 203.53 136.21 138.46
Stdev 14.01 14.94 11.52 13.04 15.05 10.22 10.86 13.70
CV 6.05 7.37 8.49 9.44 6.45 5.02 7.97 9.90
Mod CV 7.02 7.68 8.49 9.44 7.23 6.51 7.99 9.90
Min 207.41 168.68 117.18 109.48 201.16 181.16 115.00 113.93
Max 256.44 225.95 168.65 171.61 259.49 221.01 167.89 175.60
No. Batches33333333
No. Spec. 2224242422242424
B-basis Value 209.10 180.27 113.21 115.60 211.95 182.47 115.15 117.40
A-estim ate 193.90 165.04 97.98 100.37 197.74 168.23 100.91 103.16
Method pooled pooled pooled pooled pooled pooled pooled pooled
B-basis Value 207.81 178.99 111.93 114.32 209.91 180.44 113.12 115.37
A-estim ate 191.75 162.90 95.84 98.23 194.33 164.84 97.52 99.77
Method pooled pooled pooled pooled pooled pooled pooled pooled
Longitudinal Compression Strength (ksi)
Normalized As Measured
Modified CV Basis Values and/or Estimates
Basis Values and/or Estimates
Table 4-4: Statistics and B-Basis values for LC Strength data
En v C T D RT D ET W ET W2 C T D RT D ET W ET W2
Me an 16.83 17.02 17.24 19.63 17.07 17.06 17.31 19.82
Stdev 0.85 0.86 0.88 1.08 0.62 0.65 0.66 0.52
CV 5.07 5.06 5.10 5.49 3.62 3.81 3.82 2.64
Mod CV 6.54 6.53 6.55 6.74 6.00 6.00 6.00 6.00
Min 14.31 14.39 14.54 17.82 15.82 16.06 15.67 19.12
Max 17.85 18.89 18.37 20.78 18.08 18.59 18.34 20.45
No. Batches33333333
No. Spec. 18 18 17 6 18 18 17 6
Longitudinal Compression Modulus (msi)
Normalized As Measured
Table 4-5: Statistics from LC modulus data
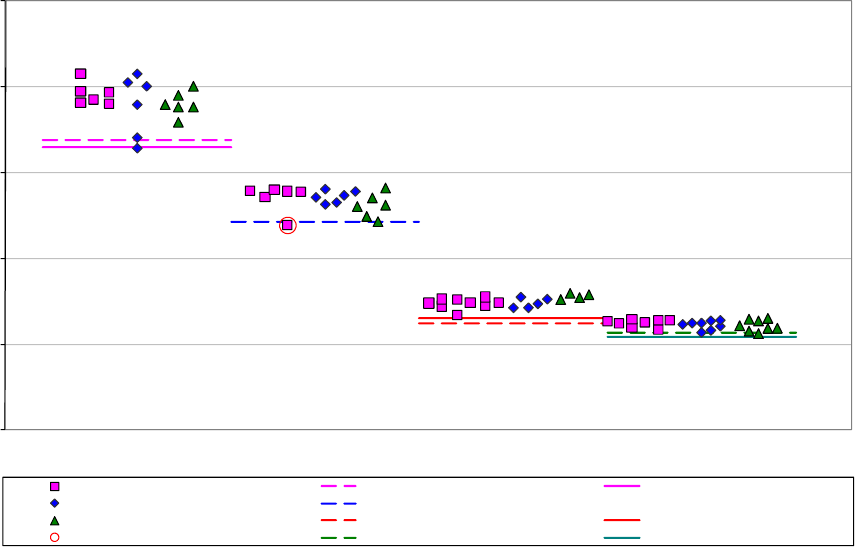
October 20, 2023 NCP-RP-2008-004 Rev B
Page 44 of 104
4.4 Transverse (90º) Compression Properties (TC)
Transverse Compression strength is not normalized because it is not a fiber dominated property
for unidirectional tape. This data meets all CMH-17-1G requirements for publication of the B-
basis values. The as measured TC strength data could not be pooled because the ETW data failed
the Anderson-Darling k-sample test for batch to batch variability and the RTD data failed the
normality test. The data was then analyzed for each condition individually using Stat-17. Since
the ETW data failed the ADK test it requires the ANOVA method to compute basis values, but
with data from only three batches, these values are considered estimates and may result in overly
conservative basis values. The ETW data does pass the normality test and passed the ADK test
under the modified CV transformation, so the modified CV values are provided for all but the
RTD dataset.
There was one outlier in the TC data. It was on the low side of batch one in the RTD
environment. It was an outlier only for batch one, not for the RTD condition. It was retained for
this analysis. Statistics and basis values are given for the as measured TC data in Table 4-6. The
data, B-basis values and B-estimates are shown graphically Figure 4-4.
0
10
20
30
40
50
ksi
CTD RTD ETW ETW2
Environmental Condition
ACG MTM45-1/AS4-145-32%RW UNI
Transverse Compression (TC) Strength as measured
Batch 1 CTD B-basis (Normal) CTD B-basis (Mod CV)
Batch 2 RTD B-basis (Weibull)
Batch 3 ETW B-estimate (ANOVA) ETW B-basis (Mod CV)
Outlier ETW2 B-basis (Normal) ETW2 B-basis (Mod CV)
Figure 4-4: Batch Plot for TC Strength data

October 20, 2023 NCP-RP-2008-004 Rev B
Page 45 of 104
En v C T D RT D ET W ET W2 C TD RT D ET W ET W2
Mean 38.35 26.81 14.96 12.30 1.42 1.25 1.18 1.27
Stdev 2.30 1.32 0.64 0.53 0.05 0.04 0.05 0.16
CV 6.01 4.93 4.26 4.32 3.44 2.95 3.91 12.40
Mod CV 7.00 6.46 6.13 6.16 6.00 6.00 6.00 12.40
Min 32.86 23.89 13.44 11.29 1.32 1.20 1.11 1.09
Max 41.58 28.20 15.96 13.05 1.49 1.33 1.28 1.45
No. Batches33333333
No. Spec. 18181824181818 7
B-basis Value 33.80 24.26 11.32
B-es tim ate 12.46
A-e stim ate 30.58 21.61 10.67 10.61
M e t h od Nor m al We ibu ll A NOV A Nor m al
B-basis Value 33.04 13.15 10.90
A-e stim ate 29.29 11.87 9.89
M e t h od Nor m al No r m al No r m al
Modified CV Basis Values and/or Estimates
Basis Values and/or Estimates
Transverse Compression
Strength (ksi) as measured Modulus (msi) as measured
Table 4-6: Statistics and Basis Values for TC Strength and Modulus data
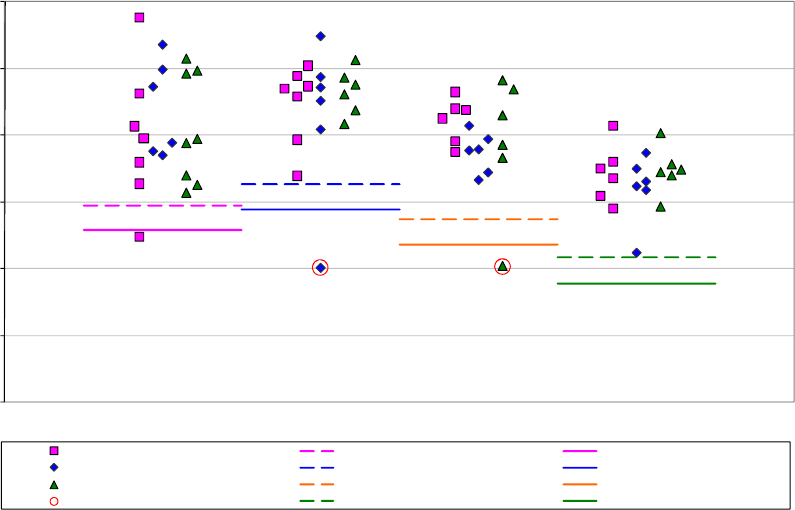
October 20, 2023 NCP-RP-2008-004 Rev B
Page 46 of 104
4.5 Unnotched Tension Properties (UNT0)
Pooling across the environments was acceptable for both the normalized and the as measured
data. The normalized and the as measured RTD data and the as measured CTD data did not pass
the normality test, but the pooled dataset for both the normalized and the as measured data did
pass the normality test.
There were four outliers in the LT data. There was one outlier in the RTD condition data. It was
an outlier for both the as measured and normalized data. It was on the low side of batch two and
was an outlier for both batch and condition in the normalized data. It was an outlier for the
condition, but not the batch in the as measured data. There were two outliers in the ETW
condition data. One outlier was on the high side of batch two for the as measured data only. It
was an outlier for batch two, but not for the ETW condition. The second outlier in the ETW data
was on the low side of batch three. It was an outlier for both the normalized and as measured
data. It was an outlier for the ETW condition, but not for batch three. The fourth outlier in the
LT data was in the ETW2 condition. It was an outlier only for the as measured data. It was on
the low side of batch two and was an outlier for both batch two and the ETW2 condition. All
four outliers were retained for this analysis.
Statistics and basis values are given for the UNT0 strength data in Table 4-7 and for the modulus
data in Table 4-8. The normalized data and the B-basis values are shown graphically in Figure
4-5.
100
110
120
130
140
150
160
ksi
CTD RTD ETW ETW2
Environmental Conditions
ACG MTM45-1/AS4-145-32%RW UNI
Unnotched Tension (UNT0) Strength Normalized
Batch 1 CTD B-basis (pooled) CTD B-basis (Mod CV)
Batch 2 RTD B-basis (pooled) RTD B-basis (Mod CV)
Batch 3 ETW B-basis (pooled) ETW B-basis (Mod CV)
Outlier ETW2 B-basis (pooled) ETW2 B-basis (Mod CV)
Figure 4-5: Batch plot for UNT0 Strength normalized

October 20, 2023 NCP-RP-2008-004 Rev B
Page 47 of 104
En v C T D RT D ET W ET W2 C TD RT D ET W ET W2
Mean 141.41 144.69 139.54 133.73 140.73 143.74 137.77 131.59
Stdev 8.49 7.55 6.36 4.29 9.26 7.78 6.11 4.64
CV 6.00 5.22 4.56 3.20 6.58 5.41 4.44 3.53
Modified CV 7.00 6.61 6.28 6.00 7.29 6.71 6.22 6.00
Min 124.83 120.23 120.43 122.50 120.98 118.71 120.20 117.94
Max 157.67 154.91 148.22 141.49 154.42 152.77 146.28 138.81
No. Batches33333333
No. Spec. 2119181821191818
B-basis Value 129.51 132.67 127.46 121.65 128.26 131.16 125.11 118.93
A-e stim ate 121.53 124.71 119.51 113.70 119.90 122.82 116.78 110.60
Method pooled pooled pooled pooled pooled pooled pooled pooled
B-basis Value 125.75 128.88 123.64 117.84 124.97 127.83 121.77 115.59
A-e stim ate 115.25 118.40 113.18 107.37 114.40 117.28 111.23 105.05
Method pooled pooled pooled pooled pooled pooled pooled pooled
Unnotched Tension (UNT0) Strength (ksi)
Normalized As Measured
Modified CV Basis Values and/or Estimates
Ba sis V a l ue s a nd/ or Esti m a te s
Table 4-7: Statistics and Basis Values for UNT0 Strength data
En v C T D RT D ET W ET W2 C TD RT D ET W ET W2
Mean 10.07 9.90 10.15 10.98 10.00 9.83 10.02 10.78
Stdev 0.54 0.22 0.40 0.39 0.50 0.20 0.38 0.35
CV 5.32 2.21 3.95 3.53 5.01 2.07 3.83 3.25
Mod CV 6.66 6.00 6.00 6.00 6.51 6.00 6.00 6.00
Min 9.17 9.53 9.51 10.36 9.19 9.40 9.40 10.30
Max 11.20 10.40 11.28 11.39 10.89 10.24 11.06 11.19
No. Batches33333333
No. Spec. 202318 9 202318 9
Unnotched Tension (UNT0) Modulus (msi)
Normalized As Measured
Table 4-8: Statistics from UNT0 Modulus data
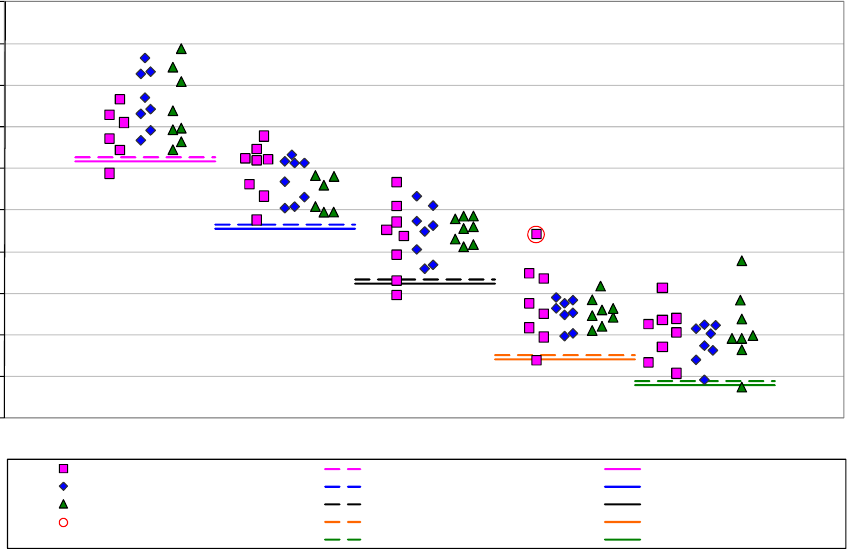
October 20, 2023 NCP-RP-2008-004 Rev B
Page 48 of 104
4.6 Unnotched Compression Properties (UNC0)
The UNC0 normalized strength data meets all CMH-17-1G requirements for pooling. There was
one outlier in batch one on the high side in the ETW environment. It was an outlier after pooling
for the ETW condition, but not batch one. It was an outlier in both the normalized and as
measured data. It was retained for this analysis.
Statistics and basis values are given for the UNC0 strength data in Table 4-9. Statistics for the
modulus data are given in Table 4-10. The normalized data and the B-basis values are shown
graphically in Figure 4-6.
50
60
70
80
90
100
110
120
130
140
150
ksi
CTD RTD ETD ETW ETW2
Environmental Conditions
ACG MTM45-1/AS4-145-32%RW UNI
Unnotched Compression (UNC0) Strength Normalized
Batch 1 CTD B-basis (pooled) CTD B-basis (Mod CV)
Batch 2 RTD B-basis (pooled) RTD B-basis (Mod CV)
Batch 3 ETD B-basis (pooled) ETD B-basis (Mod CV)
Outlier ETW B-basis (pooled) ETW B-basis (Mod CV)
ETW2 B-basis (pooled) ETW2 B-basis (Mod CV)
Figure 4-6: Batch plot for UNC0 Strength normalized

October 20, 2023 NCP-RP-2008-004 Rev B
Page 49 of 104
Env CTD RTD ETD ETW ETW2 CTD RTD ETD ETW ETW2
Mean 123.72 107.57 94.40 76.18 70.05 124.54 108.07 94.70 75.82 70.00
Stdev 8.01 5.72 6.34 6.09 6.77 8.04 5.43 6.39 6.04 6.93
CV 6.47 5.31 6.72 7.99 9.67 6.45 5.02 6.75 7.97 9.90
Modifie d CV 7.24 6.66 7.36 7.99 9.67 7.23 6.51 7.38 7.99 9.90
Min 108.80 97.65 79.66 63.87 57.62 107.44 96.20 78.05 64.02 57.60
Max 138.72 117.80 106.70 94.27 87.90 138.59 117.35 106.47 93.45 88.78
No. Batches3333333333
No. Spec. 22 24 24 24 24 22 24 24 24 24
B-bas is Value 112.63 96.57 83.40 65.18 59.05 113.47 97.09 83.72 64.84 59.02
A-e stim ate 105.26 89.19 76.02 57.80 51.67 106.10 89.71 76.34 57.46 51.64
Method pooled pooled pooled pooled pooled pooled pooled pooled pooled pooled
B-bas is Value 111.61 95.56 82.39 64.17 58.03 112.40 96.03 82.66 63.78 57.96
A-e stim ate 103.56 87.50 74.33 56.11 49.97 104.33 87.95 74.58 55.70 49.88
Method pooled pooled pooled pooled pooled pooled pooled pooled pooled pooled
Unnotched Compression (UNC0) Strength (ksi)
Modified CV Basis Values and/or Estimates
Normalized As Measured
Ba sis V a lu e s a nd/or Esti m a te s
Table 4-9: Statistics and Basis Values for UNC0 Strength data
Env CTD RTD ETD ETW ETW2 CTD RTD ETD ETW ETW2
Mean 9.06 9.01 9.48 9.68 9.99 9.12 9.06 9.50 9.64 10.02
Stdev 0.39 0.56 0.72 0.55 0.47 0.38 0.54 0.64 0.53 0.36
CV 4.31 6.16 7.56 5.67 4.72 4.18 5.98 6.74 5.53 3.64
Mod CV 6.16 7.08 7.78 6.83 8.00 6.09 6.99 7.37 6.76 8.00
Min 8.27 8.21 8.14 8.70 9.52 8.51 8.29 8.20 8.61 9.67
Max 9.86 10.72 11.69 10.60 10.71 9.95 10.59 11.33 10.77 10.56
No. Batches3333233332
No. Spec. 22 24 24 20 5 22 24 24 20 5
Unnotched Compression (UNC0) Modulus (msi)
Normalized As Measured
Table 4-10: Statistics from UNC0 Modulus data
October 20, 2023 NCP-RP-2008-004 Rev B
Page 50 of 104
4.7 In-Plane Shear Properties (IPS)
The In-Plane Shear data is not normalized. Data is reported on three properties: 0.2% Offset
Strength, Strength at 5% Strain and Modulus. The ETD condition lacks sufficient specimens to
compute B-basis values so only B-estimates are provided for that condition.
The 0.2% Offset Strength (RTD) and Strength at 5% Strain (CTD and RTD) datasets, failed the
Anderson Darling k-sample test (ADK test) for batch to batch variability, which means that
pooling across environments was not acceptable and CMH-17-1G guidelines required using the
ANOVA analysis. With fewer than 5 batches, this is considered an estimate. All three datasets
passed the ADK test after the modified CV approach was applied, so modified CV basis values
are provided.
The CTD and RTD conditions for both strength (0.2% Offset and 5% Strain) properties met all
requirements for pooling after modified CV approach.
There was one outlier. The largest value in batch two of the ETD 0.2% Offset Strength dataset
was an outlier for batch two, but not for the ETD condition. The outlier was retained for this
analysis.
Statistics and basis values are given for the IPS Strength at 5% Strain data as-measured in Table
4-11 and for the 0.2% Offset Strength data as-measured in Table 4-12. Statistics for the as-
measured modulus data are given in Table 4-13. The as-measured data, B-estimates and B-basis
values are shown graphically for the Strength at 5% Strain data in Figure 4-7 and for the 0.2%
Offset Strength data in Figure 4-8.
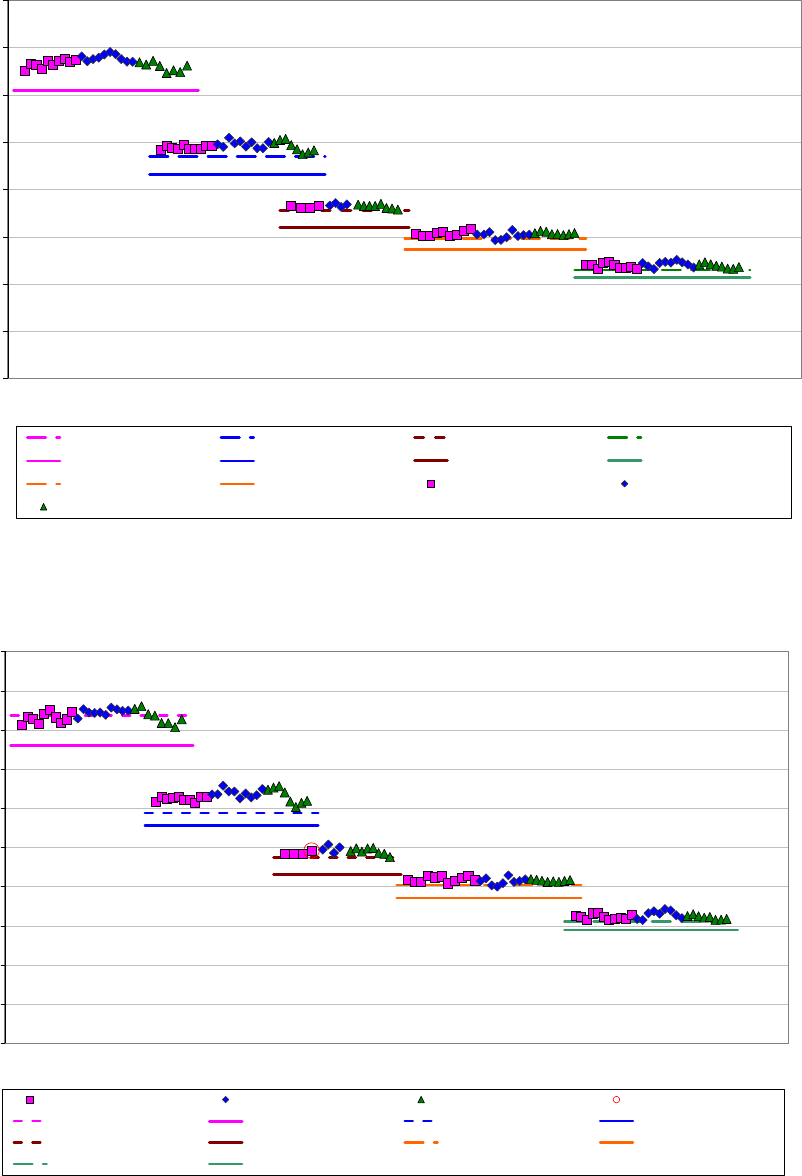
October 20, 2023 NCP-RP-2008-004 Rev B
Page 51 of 104
0
2
4
6
8
10
12
14
16
ksi
CTD RTD ETD ETW ETW2
Environmental Conditions
ACG MTM45-1/AS4-145-32%RW UNI
In-Plane Shear (IPS) 5% Strain Strength As Measured
CTD B-Estimate (ANOVA) RTD B-Estimate (ANOVA) ETD B-Estimate (Normal) ETW2 B-Basis (Normal)
CTD B-Basis (Mod CV) RTD B-Basis (Mod CV) ETD B-Estimate (Mod CV) ETW2 B-Basis (Mod CV)
ETW B-Basis (Normal) ETW B-Basis (Mod CV) Batch 2 Batch 3
Batch 4
Figure 4-7: Batch plot for IPS Strength at 5% Strain as measured
0
1
2
3
4
5
6
7
8
9
10
ksi
CTD RTD ETD ETW ETW2
Environmental Conditions
ACG MTM45-1/AS4-145-32%RW UNI
In-Plane Shear (IPS) 0.2% Offset Strength As Measured
Batch 2 Batch 3 Batch 4 Outlier
CTD B-Basis (Normal) CTD B-Basis (Mod CV) RTD B-Estimate (ANOVA) RTD B-Basis (Mod CV)
ETD B-Estimate (Normal) ETD B-Estimate (Mod CV) ETW B-Basis (Normal) ETW B-Basis (Mod CV)
ETW2 B-Basis (Normal) ETW2 B-Basis (Mod CV)
Figure 4-8: Batch plot for IPS 0.2% Offset Strength as measured

October 20, 2023 NCP-RP-2008-004 Rev B
Page 52 of 104
Env CTD RTD ETD ETW ETW2
Mean 13.37 9.83 7.28 6.11 4.79
Stdev 0.23 0.17 0.078 0.11 0.11
CV 1.70 1.70 1.07 1.82 2.29
Mod CV 6.00 6.00 6.00 6.00 6.00
Min 12.92 9.49 7.14 5.85 4.63
Max 13.81 10.18 7.42 6.32 5.02
No. Batche s 3 3 3 3 3
No. Spec.28281627 28
B-basis Value
5.91 4.59
B-es tim ate 12.20 9.39 7.13
A-e stim ate 11.36 9.07 7.01 5.76 4.45
Method ANOVA ANOVA Norm al Norm al Norm al
B-basis Value 12.17 8.64 5.44 4.27
B-estimate 6.40
A-e stim ate 11.34 7.80 5.77 4.97 3.90
Method pooled pooled Normal Normal Normal
Basis Values and/or Estimates
Modified CV Basis Values and/or Estimates
In-Plane Shear (IPS) - Strength at 5% Strain (ksi)
Table 4-11: Statistics and Basis Values for IPS Strength at 5% Strain data
Env CTD RTD ETD ETW ETW2
Mean 8.36 6.31 4.91 4.16 3.24
Stdev 0.150.140.080.07 0.08
CV 1.77 2.16 1.68 1.66 2.42
Mod CV 6.00 6.00 6.00 6.00 6.00
Min 8.076.034.754.00 3.14
Max 8.606.575.074.29 3.43
No. Batche s 3 3 3 3 3
No. Spec.28281628 28
B-basis Value 8.10 4.03 3.10
B-es tim ate 5.88 4.74
A-e stim ate 7.91 5.56 4.62 3.94 3.00
Method Normal ANOVA Normal Normal Normal
B-basis Value 7.61 5.56 3.71 2.89
B-estimate 4.31
A-e stim ate 7.08 5.03 3.89 3.39 2.64
Method pooled pooled Normal Normal Normal
Basis Values and/or Estimates
In-Plane Shear (IPS) - 0.2% Offset Strength (ksi)
Modified CV Basis Values and/or Estimates
Table 4-12: Statistics and Basis Values for IPS 0.2% Offset Strength data

October 20, 2023 NCP-RP-2008-004 Rev B
Page 53 of 104
Env CTD RTD ETD ETW ETW2
Mean 0.69 0.57 0.46 0.43 0.34
Stdev 0.014 0.015 0.012 0.0083 0.0092
CV 2.06 2.57 2.59 1.94 2.71
Mod CV 6.00 6.00 6.00 6.00 6.00
Min 0.67 0.54 0.45 0.41 0.33
Max 0.71 0.60 0.48 0.44 0.36
No. Batche s 3 3 3 3 3
No. Spec.2828162828
In-Plane Shear (IPS) - Modulus (Msi)
Table 4-13: Statistics from IPS Modulus data
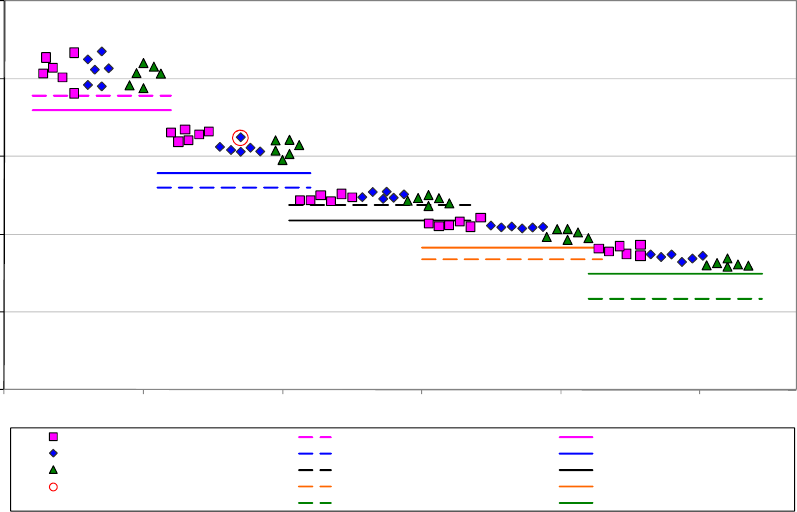
October 20, 2023 NCP-RP-2008-004 Rev B
Page 54 of 104
4.8 Short Beam Strength (SBS)
The Short Beam Strength data is not normalized. The SBS data could not be pooled as three of
the five environmental conditions (RTD, ETW and ETW2) failed the ADK test and the pooled
dataset failed Levene’s test for equality of variance after the transform to match the assumptions
of the modified CV method. In addition, the ETW environment failed the normality test.
The RTD, ETW and ETW2 environments required an ANOVA analysis. Since ANOVA is not
recommended for samples with fewer than 5 batches, these values are considered estimates and
may be overly conservative. All three of these environments passed the ADK test, so modified
CV basis values are provided. The data from the ETW environment did not pass the normality
test, but after the transform to match the assumptions of the modified CV method, the ETW data
did pass the normality test.
The SBS strength data had one outlier. It was on the high side of batch two in the data from the
RTD condition. It was an outlier only for batch two, not for the RTD condition.
Statistics and basis values are given in Table 4-14. The data, B-basis values and B-estimates are
shown graphically in Figure 4-9.
0
4
8
12
16
20
ksi
CTD RTD ETD ETW ETW2
Environmental Conditions
ACG MTM45-1/AS4-145-32%RW UNI
Short Beam Shear Strength (SBS) as measured
Batch 1 CTD B-basis (Normal) CTD B-basis (Mod CV)
Batch 2 RTD B-estimate (ANOVA) RTD B-basis (Mod CV)
Batch 3 ETD B-basis (Normal) ETD B-basis (Mod CV)
Outlier ETW B-estimate (ANOVA) ETW B-basis (Mod CV)
ETW2 B-estimate (ANOVA) ETW2 B-basis (Mod CV)
Figure 4-9: Batch plot for SBS as measured

October 20, 2023 NCP-RP-2008-004 Rev B
Page 55 of 104
Env
CTD RTD ETD ETW ETW2
Mean 16.35 12.66 9.87 8.31 6.83
Stdev 0.640.440.190.280.34
CV 3.89 3.50 1.90 3.37 4.91
Mod CV 6.00 6.00 6.00 6.00 6.45
Min 15.25 11.83 9.47 7.73 6.35
Max 17.39 13.38 10.18 8.85 7.46
No . Bat ch e s 3 3 3 3 3
No. Spec.1818181818
B-basis Value 15.09 9.50
B-estim ate 10.38 6.69 4.73
A-estim ate 14.20 8.75 9.24 5.53 3.24
Method Normal ANOVA Normal ANOVA ANOVA
B-basis Value 14.41 11.16 8.70 7.32 5.96
A-estim ate 13.04 10.10 7.88 6.63 5.34
Me thod Normal Norm al Norm al Norm al Norm al
Short Beam Strength (SBS) as measured (ksi)
Modified CV Basis Values and/or Estimates
Basis Values and/or Estimates
Table 4-14: Statistics and Basis Values for SBS data
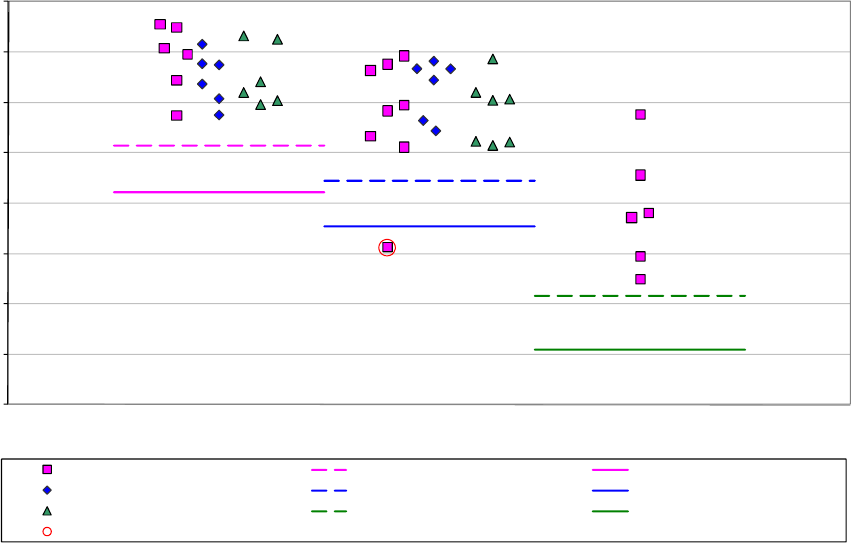
October 20, 2023 NCP-RP-2008-004 Rev B
Page 56 of 104
5. Laminate Test Results, Statistics and Basis Values
Many of the laminate tests were performed with one batch only. This is insufficient data to
produce basis values that meet the requirements of CMH-17-1G, so only estimates are provided.
Estimates were prepared using the lamina variability method documented in section 2.4 or by
pooling with the other environments when appropriate.
5.1 Unnotched Tension Properties
5.1.1 Quasi Isotropic Unnotched Tension (UNT1)
The UNT1 data meets all CMH-17 requirements for pooling, but the ETW2 environment only
had data from one batch available and thus is an estimate. There was one outlier in the UNT1
dataset. It was on the low side of batch one in the RTD environment. It was an outlier for both
the normalized and as measured data. It was an outlier for the RTD condition, but not for batch
one. It was retained for this analysis. Statistics and basis values are given for the strength data in
Table 5-1 and the modulus data in Table 5-2. The normalized strength data, B-basis values and
B-estimates are shown graphically in Figure 5-1.
80
85
90
95
100
105
110
115
120
ksi
CTD RTD ETW2
Environmental Conditions
ACG MTM45-1/AS4-145-32%RW UNI
Quasi Isotropic Unnotched Tension (UNT1) Strength normalized
Batch 1 CTD B-basis (pooled) CTD B-basis (Mod CV)
Batch 2 RTD B-basis (pooled) RTD B-basis (Mod CV)
Batch 3 ETW2 B-estimate (pooled) ETW2 B-estimate (Mod CV)
Outliers
Figure 5-1: Batch plot for UNT1 Strength normalized

October 20, 2023 NCP-RP-2008-004 Rev B
Page 57 of 104
Env CTD RTD ETW2 CTD RTD ETW2
Me an 113.13 109.54 99.38 112.20 108.82 95.92
Stdev 2.984.495.833.754.686.01
CV 2.64 4.10 5.87 3.34 4.31 6.26
Modified CV6.006.056.936.006.157.13
Min 108.72 95.61 92.46 105.15 94.04 88.44
Max 117.74 114.59 108.77 118.21 116.65 105.39
No. Batches331331
No. Spe c. 18 21 6 18 21 6
B-basis Value 105.69 102.20 104.09 100.83
B-estimate 90.84 86.62
A-e stim ate 100.68 97.17 85.98 98.64 95.34 81.33
Method pooled pooled pooled pooled pooled pooled
B-basis Value 101.08 97.66 100.14 96.93
B-estimate 85.54 82.08
A-e stim ate 92.97 89.51 77.69 92.02 88.77 74.22
Method pooled pooled pooled pooled pooled pooled
Modified CV Basis Values and/or Estimates
Normalized
Laminate Unnotched Tension (UNT1) Strength (ksi)
Basis Values and/or Estimates
As Measured
Table 5-1: Statistics and Basis Values for UNT1 Strength data
Env CTD RTD ETW2 CTD RTD ETW2
Me an 7.30 7.00 8.53 7.24 6.95 8.22
Stdev 0.420.120.460.490.150.47
CV 5.78 1.69 5.37 6.72 2.20 5.68
Mod CV 6.89 6.00 6.69 7.36 6.00 6.84
Min 6.436.827.856.366.647.55
Max 8.137.249.038.347.238.75
No. Batches331331
No. Spe c. 18 23 5 18 23 5
Laminate Unnotched Tension (UNT1) Modulus (msi)
Normalized As Measured
Table 5-2: Statistics from UNT1 Modulus Data
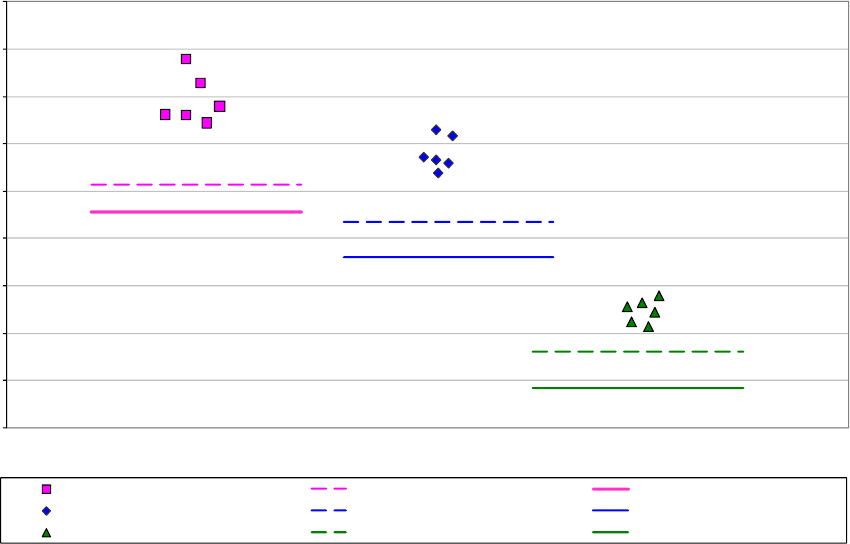
October 20, 2023 NCP-RP-2008-004 Rev B
Page 58 of 104
5.1.2 “Soft” Unnotched Tension (UNT2)
This property had data from only one batch available, thus all basis values are estimates.
Statistics and B-estimates are given for the strength data in Table 5-3 and the modulus data in
Table 5-4. The normalized strength data and B-estimates are shown graphically in Figure 5-2.
35
40
45
50
55
60
65
70
75
80
ksi
CTD RTD ETW2
Environmental Conditions
ACG MTM45-1/AS4-145-32%RW UNI
"Soft" Unnotched Tension (UNT2) Strength normalized
CTD CTD B-estimate (LVM) CTD B-estimate (Mod CV)
RTD RTD B-estimate (LVM) RTD B-estimate (Mod CV)
ETW2 ETW2 B-estimate (LVM) ETW2 B-estimate (Mod CV)
Figure 5-2: Batch plot for UNT2 Strength normalized

October 20, 2023 NCP-RP-2008-004 Rev B
Page 59 of 104
Env CTD RTD ETW2 CTD RTD ETW2
Me an 69.62 64.02 47.37 67.84 62.46 46.12
Stdev 2.591.771.222.932.280.92
CV 3.71 2.76 2.57 4.32 3.65 2.00
Modified CV8.008.008.008.008.008.00
Min 67.20 61.93 45.74 64.65 59.84 45.02
Max 73.98 66.49 48.96 72.83 65.48 47.29
No. Batches111111
No. Spec.666666
B-estim ate 60.74 56.77 43.02 58.32 55.20 42.61
Method LVMLVMLVMLVMLVMLVM
B-estim ate 57.74 53.02 39.20 56.27 51.72 38.16
Method LVMLVMLVMLVMLVMLVM
Modified CV Basis Values and/or Estimates
Basis Values and/or Estimates
Laminate Unnotched Tension (UNT2) Strength (ksi)
Normalized As Measured
Table 5-3: Statistics and Basis Values for UNT2 Strength data
Env CTD RTD ETW2 CTD RTD ETW2
Me an 4.62 4.35 4.79 4.50 4.24 4.69
Stdev 0.430.070.260.400.120.23
CV 9.36 1.62 5.39 8.78 2.85 4.95
Mod CV 9.36 6.00 6.70 8.78 6.00 6.48
Min 3.804.264.413.754.104.34
Max 4.944.434.964.844.374.82
No. Batches111111
No. Spec.664664
Laminate Unnotched Tension (UNT2) Modulus (msi)
Normalized As Measured
Table 5-4: Statistics from UNT2 Modulus Data
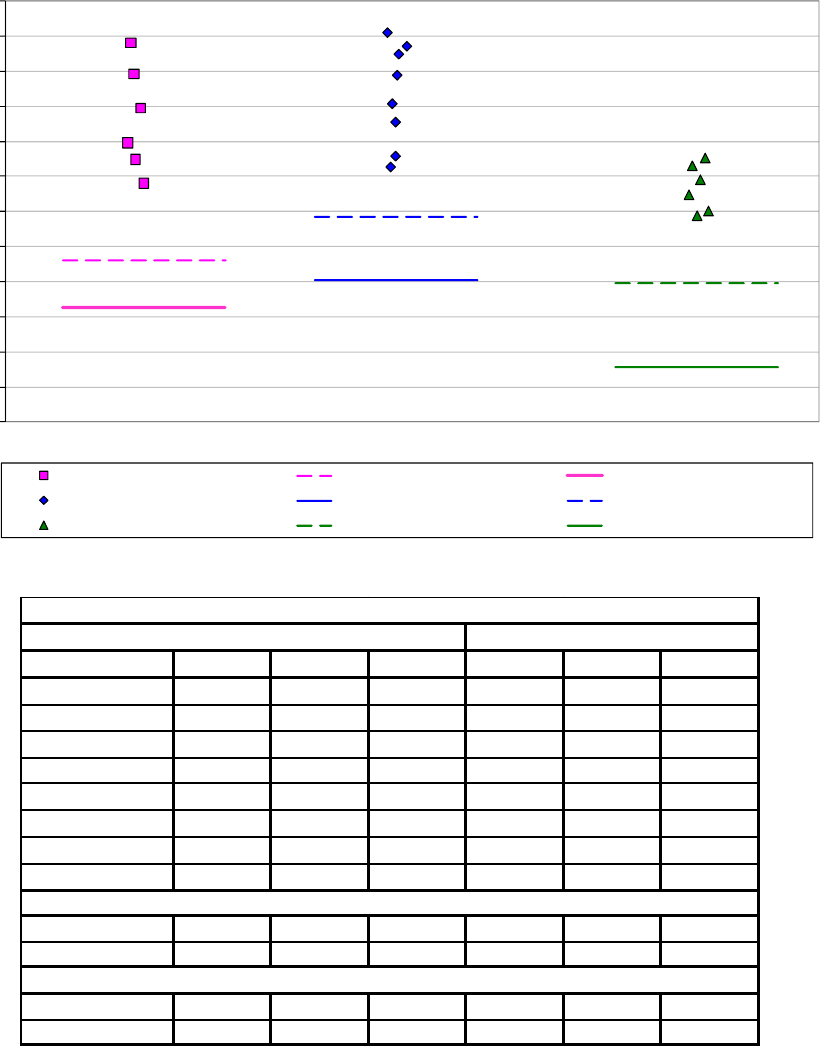
October 20, 2023 NCP-RP-2008-004 Rev B
Page 60 of 104
5.1.3 “Hard” Unnotched Tension (UNT3)
This property had data from only one batch available, thus all basis values are estimates.
Statistics and B-estimates are given for the strength data in Table 5-5 and the modulus data in
Table 5-6. The normalized strength data and B-estimates are shown graphically in Figure 5-3.
115
120
125
130
135
140
145
150
155
160
165
170
175
ksi
CTD RTD ETW2
Environmental Conditions
ACG MTM45-1/AS4-145-32%RW UNI
"Hard" Unnotched Tension (UNT3) Strength normalized
CTD CTD B-estimate (LVM) CTD B-estimate (Mod CV)
RTD RTD B-estimate (LVM) RTD B-estimate (Mod CV)
ETW2 ETW2 B-estimate (LVM) ETW2 B-estimate (Mod CV)
Figure 5-3: Batch plot for UNT3 Strength normalized
Env CTD RTD ETW2 CTD RTD ETW2
Me an 158.29 161.63 148.41 155.74 158.63 144.47
Stdev 7.63 7.24 3.40 8.21 7.21 4.30
CV 4.82 4.48 2.29 5.27 4.54 2.98
Modified CV 8.00 8.00 8.00 8.00 8.00 8.00
Min 149.04 151.32 144.35 146.38 150.09 139.66
Max 169.08 170.47 152.65 168.47 167.92 149.53
No. Batches111111
No. Spec.686686
B-estim ate 138.10 144.17 134.78 133.89 141.06 133.48
Method LVM LVM LVM LVM LVM LVM
B-estim ate 131.29 135.16 122.80 129.18 132.65 119.54
Method LVM LVM LVM LVM LVM LVM
Normalized As Measured
Modified CV Basis Values and/or Estimates
Basis Values and/or Estimates
Laminate Unnotched Tension (UNT3) Strength (ksi)
Table 5-5: Statistics and Basis Values for UNT3 Strength data

October 20, 2023 NCP-RP-2008-004 Rev B
Page 61 of 104
Env CTD RTD ETW2 CTD RTD ETW2
Me an 11.34 10.82 12.95 11.16 10.62 12.55
Stdev 0.66 0.18 0.21 0.71 0.19 0.22
CV 5.79 1.66 1.60 6.37 1.80 1.76
Mod CV 6.90 6.00 6.00 7.19 6.00 6.00
Min 10.64 10.60 12.77 10.43 10.30 12.35
Max 12.46 11.13 13.23 12.42 10.96 12.86
No. Batches111111
No. Spec.684684
Laminate Unnotched Tension (UNT3) Modulus (msi)
Normalized As Measured
Table 5-6: Statistics for UNT3 Modulus data
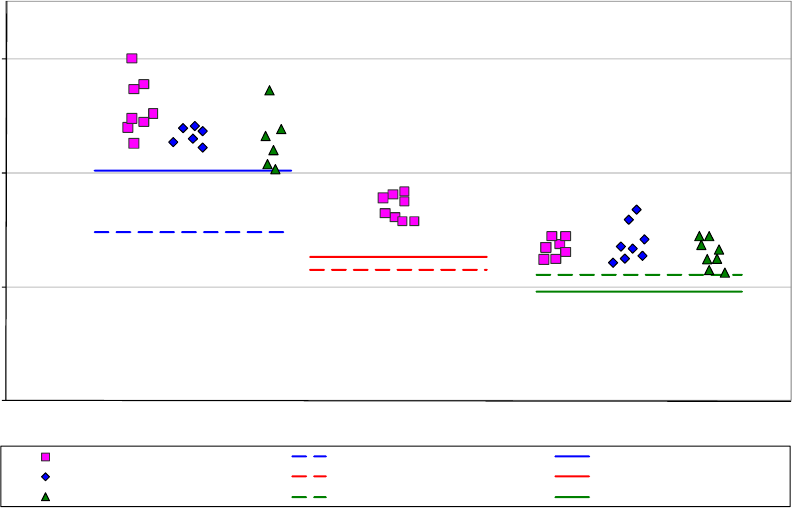
October 20, 2023 NCP-RP-2008-004 Rev B
Page 62 of 104
5.2 Unnotched Compression Properties
5.2.1 Quasi Isotropic Unnotched Compression (UNC1)
The UNC1 as measured strength data could be pooled, but the UNC1 normalized strength data
could not be pooled because the normalized data from the RTD environment did not pass the
ADK test and required an ANOVA analysis. Since ANOVA is not recommended for samples
with fewer than 5 batches, these values are considered estimates and may be overly conservative.
However, under the assumptions of the modified CV, the data from the RTD environment passed
the ADK test and pooling was permissible. The ETW environment only had data from one batch
available and thus is an estimate.
There were no outliers. Statistics and basis values are given for the strength data in Table 5-7
and the modulus data in Table 5-8. The normalized strength data, B-basis values and B-
estimates are shown graphically in Figure 5-4.
30
50
70
90
ksi
RTD ETW ETW2
Environmental Conditions
ACG MTM45-1/AS4-145-32%RW UNI
Quasi Isotropic Unnotched Compression (UNC1) Strength normalized
Batch 1 RTD B-estimate (ANOVA) RTD B-Basis (Mod CV)
Batch 2 ETW B-estimate (LVM) ETW B-estimate (Mod CV)
Batch 3 ETW2 B-basis (Normal) ETW2 B-Basis (Mod CV)
Figure 5-4: Batch plot for UNC1 Strength normalized

October 20, 2023 NCP-RP-2008-004 Rev B
Page 63 of 104
Env RTD ETW ETW2 RTD ETW ETW2
Me an 78.28 63.94 56.84 78.71 62.69 57.04
Stdev 4.832.152.574.412.052.86
CV 6.17 3.35 4.52 5.60 3.27 5.02
Modified CV7.086.006.266.806.006.51
Min 70.58 61.49 52.48 71.83 60.28 52.94
Max 90.07 66.69 63.58 88.77 65.40 64.72
No. Batches313313
No. Spec.2082420824
B-basis Value 52.08 72.63 51.05
B-e stim ate 59.57 53.00 55.92
A-e stim ate 46.23 NA 48.66 68.51 51.90 46.91
Method ANOVA LVM Normal pooled pooled pooled
B-basis Value 70.43 49.12 70.93 49.39
B-e stim ate 55.21 54.03
A-e stim ate 65.11 50.02 43.77 65.66 48.90 44.09
Method pooled pooled pooled pooled pooled pooled
Laminate Unnotched Compression (UNC1) Strength (ksi)
Normalized As Measured
Modified CV Basis Values and/or Estimates
Basis Values and/or Estimates
Table 5-7: Statistics and Basis Values for UNC1 Strength data
Env RTD ETW ETW2 RTD ETW ETW2
Me an 6.29 6.86 6.99 6.33 6.72 6.98
Stdev 0.180.250.330.170.250.29
CV 2.83 3.63 4.75 2.61 3.74 4.20
Mod CV 6.00 6.00 6.37 6.00 6.00 6.10
Min 5.866.616.346.046.456.45
Max 6.617.367.396.577.227.31
No. Batches313313
No. Spec.197 7197 7
Laminate Unnotched Compression (UNC1) Modulus (msi)
Normalized As Measured
Table 5-8: Statistics from UNC1 Modulus data
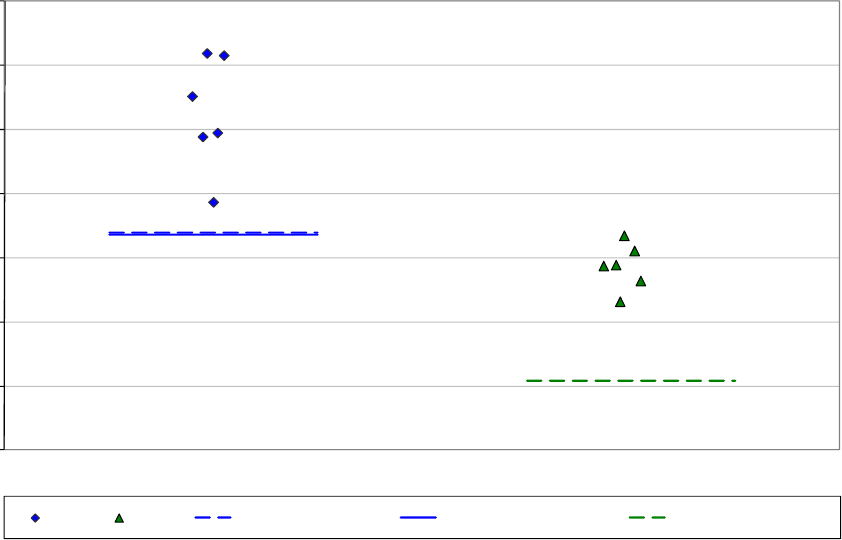
October 20, 2023 NCP-RP-2008-004 Rev B
Page 64 of 104
5.2.2 “Soft” Unnotched Compression (UNC2)
This property had data from only one batch available, thus all basis values are estimates.
Modified CV values are not available for the ETW2 condition due to the large CV of the LC
lamina data for the ETW2 condition which was used to compute the LVM B-estimate. Statistics
and B-estimates are given for the strength data in Table 5-9 and the modulus data in Table 5-10.
The normalized strength data and B-estimates are shown graphically in Figure 5-5.
30
35
40
45
50
55
60
65
ksi
RTD ETW2
Environmental Conditions
ACG MTM45-1/AS4-145-32%RW UNI
"Soft" Unnotched Compression (UNC2) Strength normalized
RTD ETW2 RTD B-estimate (LVM) RTD B-estimate (Mod CV) ETW2 B-estimate (LVM)
Figure 5-5: Batch plot for UNC2 Strength normalized

October 20, 2023 NCP-RP-2008-004 Rev B
Page 65 of 104
En v RT D ET W2 RT D ET W2
Me an 56.30 44.27 55.20 43.00
Stdev 4.411.804.301.62
CV 7.83 4.06 7.80 3.78
Modified CV8.008.008.008.00
Min 49.35 41.53 48.40 40.34
Max 60.93 46.69 59.88 44.68
No. Bat ch e s 1 1 1 1
No. Sp e c. 6 6 6 6
B-estim ate 46.98 35.44 46.11 34.01
Method LVM LVM LVM LVM
B-e stim ate 46.78 NA 45.88 NA
Method LVM NA LVM NA
Normalized
Modified CV Basis Values and/or Estimates
Basis Values and/or Estimates
As Measured
Laminate Unnotched Compression (UNC2) Strength (ksi)
Table 5-9: Statistics and Basis Values for UNC2 Strength data
En v RT D ET W2 RT D ET W2
Me an 4.06 4.20 3.99 4.08
Stdev 0.110.230.120.19
CV 2.60 5.57 3.01 4.68
Mod CV 6.00 6.79 6.00 6.34
Min 3.883.963.783.87
Max 4.174.534.114.33
No. Bat ch e s 1 1 1 1
No. Sp e c. 6 6 6 6
Normalized
Laminate Unnotched Compression (UNC2) Modulus (msi)
As Measured
Table 5-10: Statistics from UNC2 Modulus data
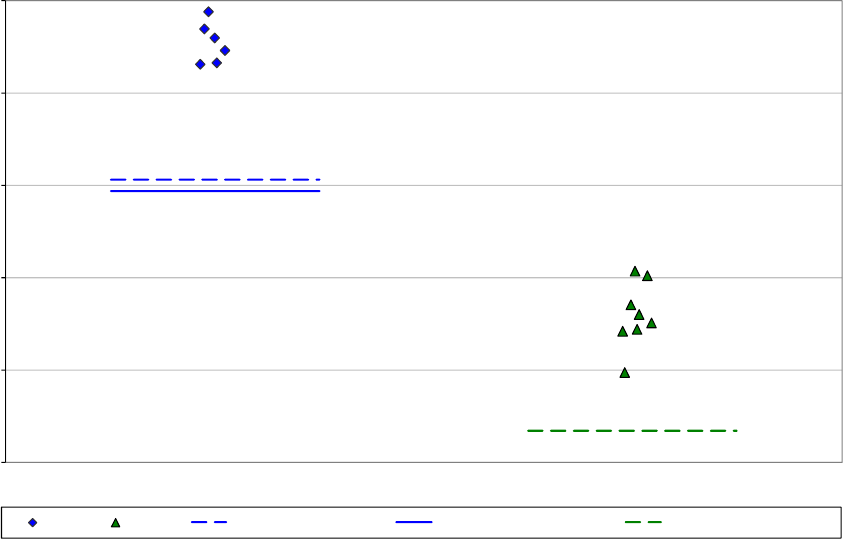
October 20, 2023 NCP-RP-2008-004 Rev B
Page 66 of 104
5.2.3 “Hard” Unnotched Compression (UNC3)
This property had data from only one batch available, thus all basis values are estimates.
Modified CV values are not available for the ETW2 condition due to the large CV of the LC
lamina data for the ETW2 condition which was used to compute the LVM B-estimate. Statistics
and B-estimates are given for the strength data in Table 5-11 and the modulus data in Table 5-12.
The normalized strength data and B-estimates are shown graphically in Figure 5-6.
50
60
70
80
90
100
ksi
RTD ETW2
Environmental Conditions
ACG MTM45-1/AS4-145-32%RW UNI
"Hard" Unnotched Compression (UNC3) Strength normalized
RTD ETW2 RTD B-estimate (LVM) RTD B-estimate (Mod CV) ETW2 B-estimate (LVM)
Figure 5-6: Batch plot for UNC3 Strength normalized

October 20, 2023 NCP-RP-2008-004 Rev B
Page 67 of 104
En v RT D ET W2 RT D ET W2
Me an 95.48 65.89 95.32 64.60
Stdev 2.21 3.53 1.55 3.19
CV 2.31 5.36 1.63 4.93
Modified CV 8.00 8.00 8.00 8.00
Min 93.16 59.67 93.09 58.52
Max 98.81 70.68 97.63 69.23
No . Bat ch e s 1 1 1 1
No. Sp e c. 6 8 6 8
B-estim ate 80.63 53.35 85.21 51.71
Method LVM LVM LVM LVM
B-e stim ate 79.35 NA 79.22 NA
Method LVM NA LVM NA
Modified CV Basis Values and/or Estimates
Normalized As Measured
Laminate Unnotched Compression (UNC3) Strength (ksi)
Basis Values and/or Estimates
Table 5-11: Statistics and Basis Values for UNC3 Strength data
En v RT D ET W2 RT D ET W2
Me an 9.78 11.13 9.77 10.88
Stdev 0.38 0.70 0.31 0.71
CV 3.92 6.30 3.14 6.52
Mod CV 6.00 7.15 6.00 7.26
Min 9.20 10.17 9.34 9.77
Max 10.27 12.16 10.18 11.82
No . Bat ch e s 1 1 1 1
No. Sp e c. 6 6 6 6
Laminate Unnotched Compression (UNC3) Modulus (msi)
Normalized As Measured
Table 5-12: Statistics from UNC3 Modulus Data
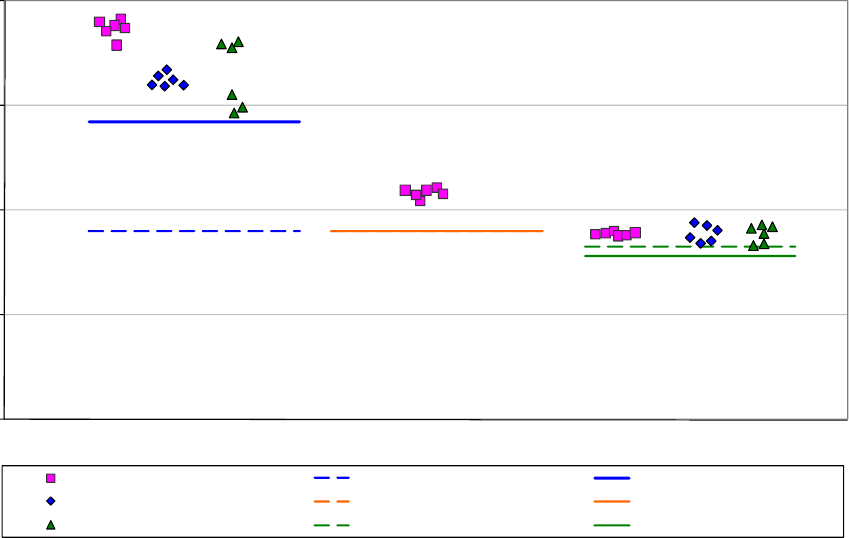
October 20, 2023 NCP-RP-2008-004 Rev B
Page 68 of 104
5.3 Laminate Short Beam Shear Properties (LSBS)
The LSBS data is not normalized. Only the data for the ETW2 condition meets all requirements
of CMH-17-1G. The RTD data does not pass the ADK test, even after the transformation to fit
the assumptions of the modified CV approach. It required an ANOVA analysis and since
ANOVA is not recommended for samples with fewer than 5 batches, these values are considered
estimates and may be overly conservative. B-estimates computed using the modified CV method
are provided for the RTD environment.
There was insufficient data for the ETW condition. There were no outliers. Statistics, basis
values and estimates are given for the LSBS data in Table 5-13. The strength data, B-basis
values and B-estimates are shown graphically in Figure 5-7.
0
3
6
9
12
ksi
RTD ETW ETW2
Environmental Conditions
ACG MTM45-1/AS4-145-32%RW UNI
Laminate Short Beam Strength (LSBS) as measured
Batch 1 RTD B-estimate (ANOVA) RTD B-estimate (Mod CV)
Batch 2 ETW B-estimate (LVM) ETW B-estimate (Mod CV)
Batch 3 ETW2 B-basis (Normal) ETW2 B-basis (Mod CV)
Figure 5-7: Batch plot for LSBS as measured

October 20, 2023 NCP-RP-2008-004 Rev B
Page 69 of 104
En v RT D ET W ET W2
Mean 10.28 6.50 5.34
Stdev 0.880.140.19
CV 8.56 2.14 3.62
Mod CV 8.56 8.00 6.00
Min 8.786.264.99
Max 11.48 6.65 5.66
No. Batche s 3 1 3
No. Spec.18618
B-basis Value 4.96
B-es tim ate 5.40 5.41
A-e stim ate 1.93 NA 4.69
Method ANOVA LVM Normal
B-basis Value 4.70
B-es tim ate 8.54 5.40
A-e stim ate 7.31 NA 4.26
Method Normal LVM Normal
Laminate Short Beam (LSBS) Strength (ksi)
Modified CV Basis Values and/or Estimates
Basis Values and/or Estimates
Table 5-13: Statistics and Basis Values for LSBS data
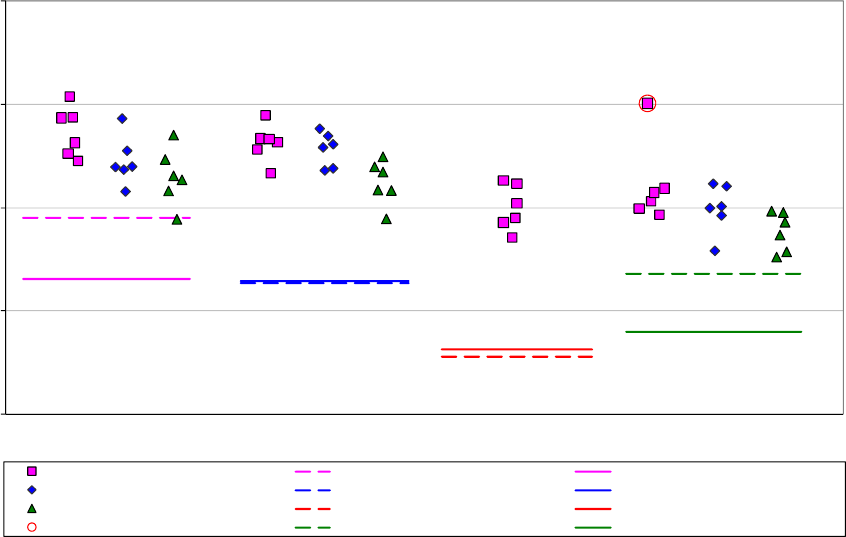
October 20, 2023 NCP-RP-2008-004 Rev B
Page 70 of 104
5.4 Open Hole Tension Properties
5.4.1 Quasi Isotropic Open Hole Tension (OHT1)
The as measured OHT1 strength data met all requirements for pooling across environments, but
the normalized OHT1 strength data could not be pooled because the RTD data failed the
Anderson-Darling k-sample test for batch to batch variability. Since the RTD data failed the
ADK test it requires the ANOVA method to compute basis values, but with data from only three
batches, these values are considered estimates and may result in overly conservative basis values.
The normalized RTD data does pass the normality test and passed the ADK test under the
modified CV transformation, so the modified CV values are provided. There was insufficient
data for the ETW condition so only estimates are provided.
There was an outlier on the high side of batch one of the ETW2 data. The normalized value was
an outlier both for batch one and for the ETW2 condition while the as measured value was only
an outlier for batch one. There was an outlier on the high side of batch two of the as measured
RTD data. It was an outlier only for batch two and not for the RTD condition.
Statistics, basis values and estimates are given for the strength data in Table 5-14. The
normalized strength data, B-basis values and B-estimates are shown graphically in Figure 5-8.
45
50
55
60
65
ksi
CTD RTD ETW ETW2
Environmental Conditions
ACG MTM45-1/AS4-145-32%RW UNI
Quasi Isotropic Open Hole Tension (OHT1) Strength normalized
Batch 1 CTD B-basis (Normal) CTD B-basis (Mod CV)
Batch 2 RTD B-estimate (ANOVA) RTD B-basis (Mod CV)
Batch 3 ETW B-estimate (LVM) ETW B-basis (Mod CV)
Outliers ETW2 B-basis (Non- Parametric) ETW2 B-basis (Mod CV)
Figure 5-8: Batch plot for OHT1 Strength normalized

October 20, 2023 NCP-RP-2008-004 Rev B
Page 71 of 104
Env CTD RTD ETW ETW2 CTD RTD ETW ETW2
Mean 57.49 57.39 55.01 54.96 57.65 57.72 53.56 54.54
Stdev 1.51 1.24 1.09 1.66 1.39 1.51 1.16 1.31
CV 2.63 2.15 1.98 3.02 2.41 2.62 2.16 2.40
Modified CV 6.00 6.00 6.00 6.00 6.00 6.00 6.00 6.00
Min 54.43 54.45 53.57 52.59 55.11 53.96 52.43 52.67
Max 60.40 59.48 56.31 60.05 59.51 60.59 55.38 57.90
No. Batches33133313
No. Spe c. 18 18 6 18 18 18 6 18
B-basis Value 54.51 51.82 55.21 55.29 52.10
B-es tim ate 51.36 47.79 50.75
A-estim ate 52.39 47.07 NA 43.12 53.59 53.66 49.17 50.48
Method Normal ANOVA LVM
Non-
Par am e tr ic
pooled pooled pooled pooled
B-basis Value 51.52 51.42 48.99 51.69 51.77 48.58
B-estimate 48.13 46.69
A-estim ate 47.55 47.45 44.27 45.02 47.73 47.80 42.84 44.62
Method pooled pooled pooled pooled pooled pooled pooled pooled
Normalized As Measured
Modified CV Basis Values and/or Estimates
Basis Values and/or Estimates
Laminate Open Hole Tension (OHT1) Strength (ksi)
Table 5-14: Statistics and Basis Values for OHT1 Strength data
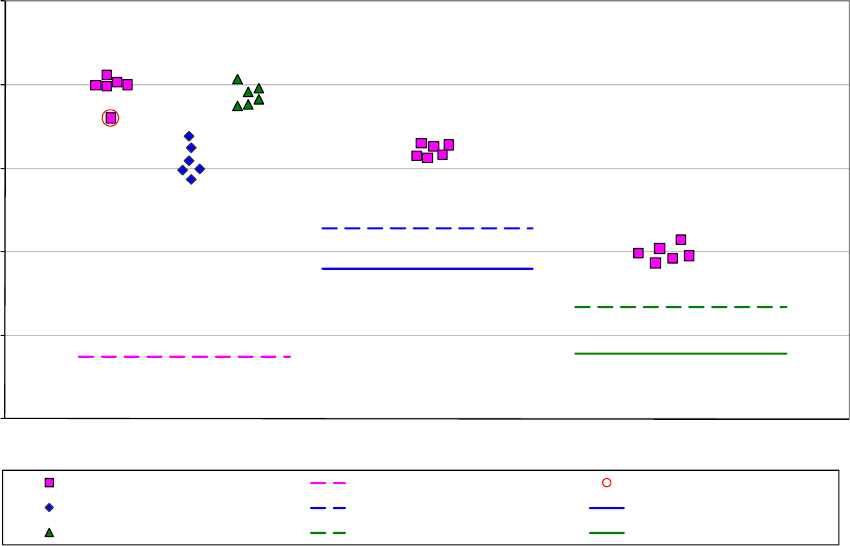
October 20, 2023 NCP-RP-2008-004 Rev B
Page 72 of 104
5.4.2 “Soft” Open Hole Tension (OHT2)
The data from the CTD condition, both normalized and as measured, did not pass the ADK test
or the normality test. Since the CTD data failed the ADK test it requires the ANOVA method to
compute basis values, but with data from only three batches, these values are considered
estimates and may result in overly conservative basis values. Since the CTD data fails the
normality test, modified CV estimates of basis values cannot be provided. The RTD and ETW2
environments had insufficient data for publication in the handbook, so only estimates are
provided.
There was one outlier on the low side of batch one in the normalized CTD data. It was an outlier
only for batch one, not for the CTD condition. Statistics, A- and B-estimates are given for the
strength data in Table 5-15. The normalized strength data and B-estimates are shown graphically
in Figure 5-9.
25
30
35
40
45
50
ksi
CT D RT D ETW2
Environmental Conditions
ACG MTM45-1/AS4-145-32%RW UNI
"Soft" Open Hole Tension (OHT2) Strength normalized
Batch 1 CTD B-estimate (ANOVA) Outliers
Batch 2 RTD B-estimate (LVM) RTD B-estimate (Mod CV)
Batch 3 ETW2 B-estimate (LVM) ETW2 B-estimate (Mod CV)
Figure 5-9: Batch plot for OHT2 Strength normalized

October 20, 2023 NCP-RP-2008-004 Rev B
Page 73 of 104
Env CTD RTD ETW2 CTD RTD ETW2
Me an 43.22 41.06 34.93 44.02 41.34 34.61
Stdev 2.140.370.491.780.880.48
CV 4.96 0.91 1.40 4.04 2.12 1.39
Modified CV6.488.008.006.028.008.00
Min 39.36 40.63 34.35 40.77 40.35 34.14
Max 45.61 41.49 35.74 46.20 42.71 35.45
No. Batches311311
No. Spec.186 6186 6
B-estim ate 28.71 36.41 31.73 32.93 36.54 31.98
A-e stim ate 18.36 NA NA 25.01 NA NA
Method ANOVA LVM LVM ANOVA LVM LVM
B-estim ate NA 34.00 28.91 NA 34.24 28.64
A-e s t im at e NA NA NA NA NA NA
M e t h o d NA L V M L V M NA LV M LV M
Laminate Open Hole Tension (OHT2) Strength (ksi)
Modified CV Basis Values and/or Estimates
Basis Values and/or Estimates
Normalized As Measured
Table 5-15: Statistics and Basis Values for OHT2 Strength data

October 20, 2023 NCP-RP-2008-004 Rev B
Page 74 of 104
5.4.3 “Hard” Open Hole Tension (OHT3)
Only the CTD data meets the requirements of CMH-17-1G. The normalized CTD data did not
pass the ADK test so it requires the ANOVA method to compute basis values, but with data from
only three batches, these values are considered estimates and may result in overly conservative
basis values. However, the normalized CTD data did pass the ADK test after the modified CV
transform and modified CV basis values are provided.
The RTD and ETW2 environments had insufficient data for publication in the handbook, so only
estimates are provided. There were no outliers. Statistics, basis values and estimates are given
for the strength data in Table 5-16. The normalized strength data, B-basis values and B-
estimates are shown graphically in Figure 5-10.
60
65
70
75
80
85
90
95
100
105
ksi
CTD RTD ETW2
Environmental Conditions
ACG MTM45-1/AS4-145-32%RW UNI
"Hard" Open Hole Tension (OHT3) Strength normalized
Batch 1 CTD B-estimate (ANOVA) CTD B-basis (Mod CV)
Batch 2 RTD B-estimate (LVM) RTD B-estimate (Mod CV)
Batch 3 ETW2 B-estimate (LVM) ETW2 B-estimate (Mod CV)
Figure 5-10: Batch plot for OHT3 Strength normalized

October 20, 2023 NCP-RP-2008-004 Rev B
Page 75 of 104
Env CTD RTD ETW2 CTD RTD ETW2
Me an 90.56 93.57 96.13 90.38 91.81 94.04
Stdev 5.39 3.53 2.39 4.59 3.00 2.19
CV 5.96 3.77 2.49 5.08 3.26 2.33
Modified CV 6.98 8.00 8.00 6.54 8.00 8.00
Min 80.79 89.53 92.19 83.12 88.43 90.74
Max 98.28 97.89 99.42 98.22 95.69 96.58
No. Batches311311
No. Spec.186 6186 6
B-basis Value 81.32
B-estim ate 62.46 82.97 87.31 81.14 86.88
A-e stim ate 42.43 NA NA 74.90 NA NA
Method ANOVA LVM LVM Normal LVM LVM
B-basis Value 78.08 78.71
B-estim ate 77.49 79.54 76.03 77.81
A-e stim ate 69.26 NA NA 70.46 NA NA
Method Normal LVM LVM Normal LVM LVM
Laminate Open Hole Tension (OHT3) Strength (ksi)
Normalized As Measured
Modified CV Basis Values and/or Estimates
Basis Values and/or Estimates
Table 5-16: Statistics and Basis Values for OHT3 Strength data
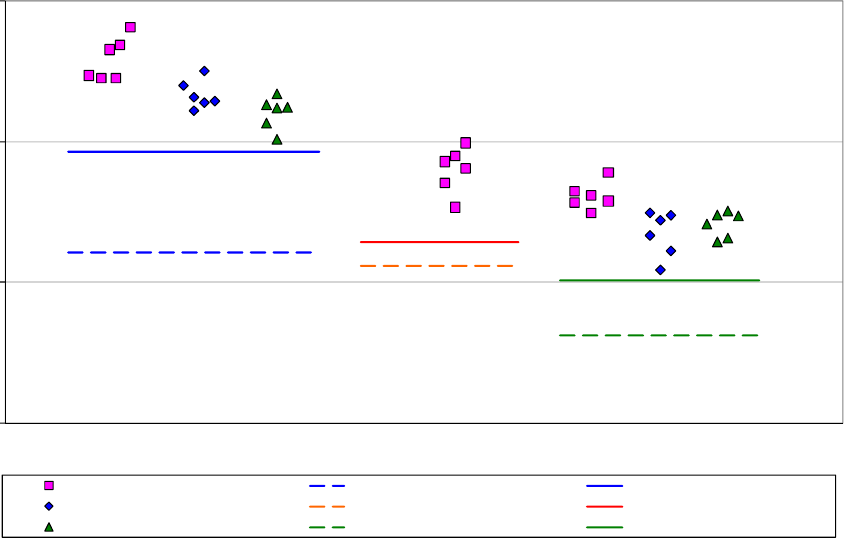
October 20, 2023 NCP-RP-2008-004 Rev B
Page 76 of 104
5.5 Open Hole Compression Properties
5.5.1 Quasi Isotropic Open Hole Compression (OHC1)
The normalized RTD and ETW2 data did not pass the ADK test and required an ANOVA
analysis to compute basis values, but with data from only three batches, these values are
considered estimates and may result in overly conservative basis values.. However, those
datasets did pass the ADK test after the modified CV transform and modified CV basis values
are provided. Pooling was acceptable for the modified CV approach. The ETW condition has
insufficient data for publishable basis values. Estimates only are provided.
There were no outliers. Statistics, basis values and estimates are given for the strength data in
Table 5-17 . The normalized strength data, B-basis values and B-estimates are shown
graphically in Figure 5-11.
20
30
40
50
ksi
RTD ETW ETW2
Environmental Conditions
ACG MTM45-1/AS4-145-32%RW UNI
Quasi Isotropic Open Hole Compression (OHC1) Strength normalized
Batch 1 RTD B-estimate (ANOVA) RTD B-basis (Mod CV)
Batch 2 ETW B-estimate (LVM) ETW B-estimate (Mod CV)
Batch 3 ETW2 B-estimate (ANOVA) ETW2 B-basis (Mod CV)
Figure 5-11: Batch plot for OHC1 Strength normalized

October 20, 2023 NCP-RP-2008-004 Rev B
Page 77 of 104
Env RTD ETW ETW2 RTD ETW ETW2
Me an 43.76 37.99 34.57 43.75 37.39 34.49
Stdev 2.001.611.641.591.621.66
CV 4.57 4.24 4.74 3.63 4.33 4.82
Modified CV6.286.126.376.006.176.41
Min 40.19 35.32 30.88 40.60 34.67 30.10
Max 48.11 39.90 37.80 46.78 39.31 37.25
No. Batches313313
No. Spec.1861818618
B-basis Value 40.82 31.56
B-estim ate 32.15 31.18 26.23 34.04
A-e stim ate 23.87 NA 20.28 38.84 32.12 29.58
Method ANOVA LVM ANOVA pooled pooled pooled
B-basis Value 39.31 30.12 39.40 30.14
B-e stim ate 32.89 32.41
A-e stim ate 36.30 29.98 27.11 36.47 29.57 27.20
Method pooled pooled pooled pooled pooled pooled
As Measured
Basis Values and/or Estimates
Modified CV Basis Values and/or Estimates
Normalized
Laminate Open Hole Compression (OHC1) Strength (ksi)
Table 5-17: Statistics and Basis Values for OHC1 Strength data
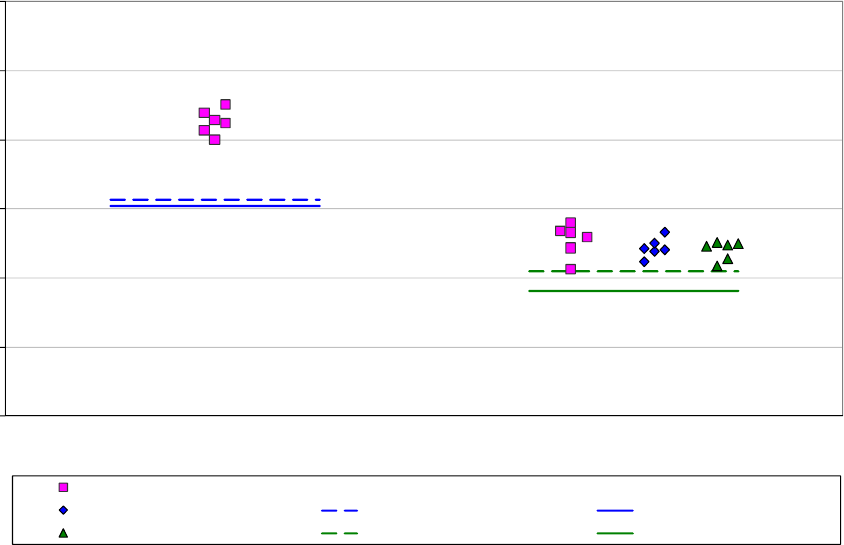
October 20, 2023 NCP-RP-2008-004 Rev B
Page 78 of 104
5.5.2 “Soft” Open Hole Compression (OHC2)
There were no outliers or test failures. The RTD data is insufficient to generate basis values that
meet the requirements of CMH-17-1G so only estimates are provided for that condition.
Statistics, basis values and estimates are given for the strength data in Table 5-18. The
normalized strength data, B-basis values and B-estimates are shown graphically in Figure 5-12.
15
20
25
30
35
40
45
ksi
RTD ETW2
Environmental Conditions
ACG MTM45-1/AS4-145-32%RW UNI
"Soft" Open Hole Compression (OHC2) Strength normalized
Batch 1
Batch 2 RTD B-estimate (LVM) RTD B-estimate (Mod CV)
Batch 3 ETW2 B-basis (Normal) ETW2 B-basis (Mod CV)
Figure 5-12: Batch plot for OHC2 Strength normalized

October 20, 2023 NCP-RP-2008-004 Rev B
Page 79 of 104
En v RT D ET W2 RT D ET W2
Me an 36.32 27.31 35.75 27.45
Stdev 0.920.900.930.90
CV 2.53 3.31 2.60 3.27
Modified CV8.006.008.006.00
Min 34.99 25.62 34.42 25.32
Max 37.59 29.01 37.18 28.67
No. Bat ch e s 1 3 1 3
No. Spec. 618618
B-basis Value 25.52 25.68
B-e stim ate 30.67 31.96
A-e stim ate NA 24.26 NA 24.42
Method LVM Normal LVM Normal
B-basis Value 24.07 24.20
B-e stim ate 30.18 29.71
A-e stim ate NA 21.78 NA 21.90
Method LVM Normal LVM Normal
Basis Values and/or Estimates
Modified CV Basis Values and/or Estimates
Laminate Open Hole Compression (OHC2) Strength (ksi)
Normalized As Measured
Table 5-18: Statistics and Basis Values for OHC2 Strength data
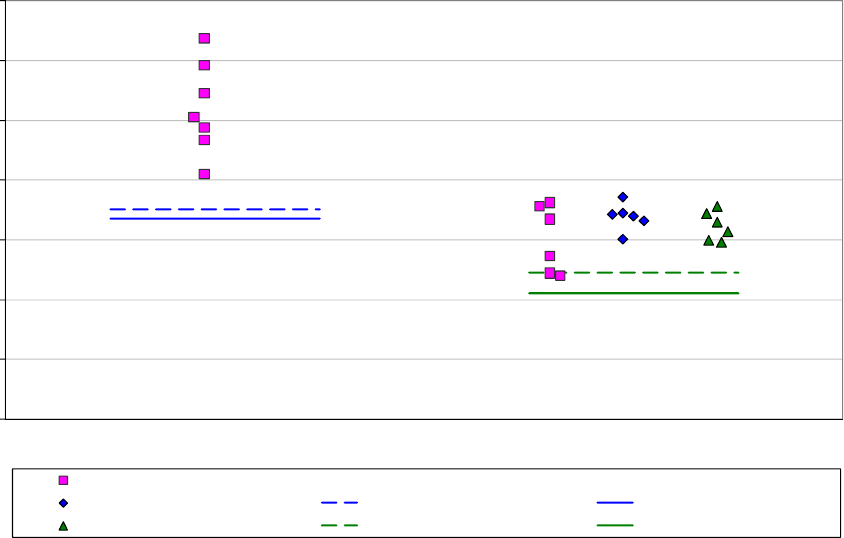
October 20, 2023 NCP-RP-2008-004 Rev B
Page 80 of 104
5.5.3 “Hard” Open Hole Compression (OHC3)
There were no outliers or test failures. The RTD data is insufficient to generate basis values that
meet the requirements of CMH-17-1G so only estimates are provided for that condition. The
ETW2 as measured data does not fit a normal distribution, so no modified CV basis values are
provided for that dataset. Statistics, basis values and estimates are given for the strength data in
Table 5-19. The normalized strength data, B-basis values and B-estimates are shown graphically
in Figure 5-13.
30
35
40
45
50
55
60
65
ksi
RTD ETW2
Environmental Conditions
ACG MTM45-1/AS4-145-32%RW UNI
"Hard" Open Hole Compression (OHC3) Strength normalized
Batch 1
Batch 2 RTD B-estimate (LVM) RTD B-estimate (Mod CV)
Batch 3 ETW2 B-basis (Normal) ETW2 B-basis (Mod CV)
Figure 5-13: Batch plot for OHC3 Strength normalized

October 20, 2023 NCP-RP-2008-004 Rev B
Page 81 of 104
En v RT D ET W2 RT D ET W2
Me an 56.05 46.06 55.63 46.86
Stdev 3.85 1.92 4.24 2.42
CV 6.87 4.18 7.62 5.16
Modified CV 8.00 6.09 8.00 6.58
Min 50.53 42.04 49.92 41.50
Max 61.87 48.58 61.83 50.06
No . Bat ch e s 1 3 1 3
No. Sp e c. 7 18 7 18
B-basis Value 42.26 41.90
B-e stim ate 47.55 46.90
A-e stim ate NA 39.57 NA 36.85
Method LVM Normal LVM Weibull
B-basis Value 40.53 NA
B-e stim ate 46.82 46.47
A-e s t im at e NA 36.61 NA NA
Method LVM Normal LVM NA
Laminate Open Hole Compression (OHC3) Strength (ksi)
Normalized As Measured
Basis Values and/or Estimates
Modified CV Basis Values and/or Estimates
Table 5-19: Statistics and Basis Values for OHC3 Strength data
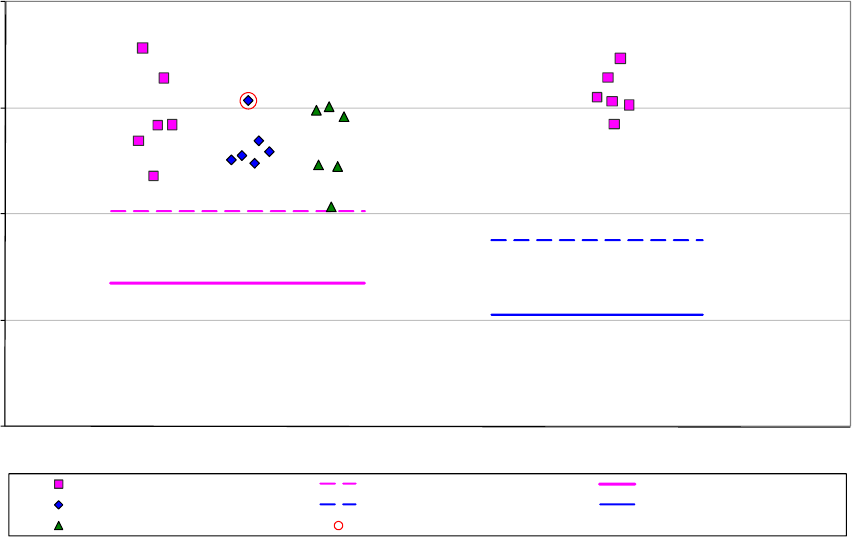
October 20, 2023 NCP-RP-2008-004 Rev B
Page 82 of 104
5.6 Filled Hole Tension Properties
5.6.1 Quasi Isotropic Filled Hole Tension (FHT1)
The data from the CTD environment meets all requirements of CMH-17-1G. The RTD data is
insufficient to generate basis values that meet the requirements of CMH-17-1G so only estimates
are provided for that condition.
There was one outlier on the high side of batch two in the CTD data. It was an outlier only for
the normalized data and only for batch two, not for the as measured data or for the CTD
environment. Statistics, basis values and estimates are given for the strength data in Table 5-20.
The normalized strength data, B-basis values and B-estimates are shown graphically in Figure
5-14.
45
50
55
60
65
ksi
CTD RTD
Environmental Conditions
ACG MTM45-1/AS4-145-32%RW UNI
Quasi Isotropic Filled Hole Tension (FHT1) Strength normalized
Batch 1 CTD B-basis (Normal) CTD B-basis (Mod CV)
Batch 2 RTD B-estimate (LVM) RTD B-estimate (Mod CV)
Batch 3 Outlier
Figure 5-14: Batch plot for FHT1 Strength normalized

October 20, 2023 NCP-RP-2008-004 Rev B
Page 83 of 104
Env CTD RTD CTD RTD
Me an 58.71 60.67 58.51 59.77
Stdev 1.801.081.820.87
CV 3.07 1.77 3.12 1.46
Modified CV6.008.006.008.00
Min 55.33 59.26 55.73 58.63
Max 62.83 62.34 61.34 61.30
No. Bat ch e s 3 1 3 1
No. Spec.186186
B-basis Value 55.16 54.91
B-estim ate 53.80 52.82
A-estim ate 52.64 NA 52.36 NA
Method Normal LVM Normal LVM
B-basis Value 51.76 51.58
B-estim ate 50.25 49.50
A-estim ate 46.84 NA 46.68 NA
Method Normal LVM Normal LVM
Modified CV Basis Values and/or Estimates
Laminate Filled-Hole Tension (FHT1) Strength (ksi)
Normalized As Measured
Basis Values and/or Estimates
Table 5-20: Statistics and Basis Values for FHT1 Strength data
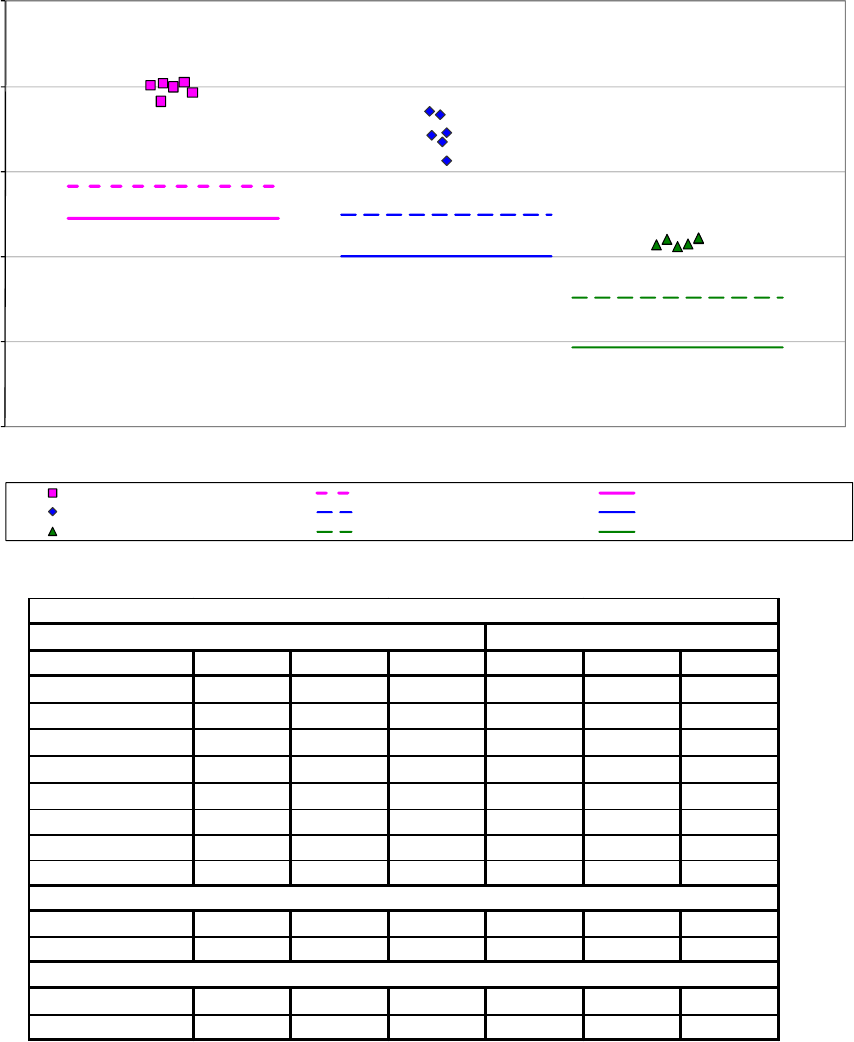
October 20, 2023 NCP-RP-2008-004 Rev B
Page 84 of 104
5.6.2 “Soft” Filled Hole Tension (FHT2)
This property had data from only one batch available, thus all basis values are estimates.
Statistics and B-estimates are given for the strength data in Table 5-21. The normalized strength
data and B-estimates are shown graphically in Figure 5-15.
25
30
35
40
45
50
ksi
CTD RTD ETW2
Environmental Conditions
ACG MTM45-1/AS4-145-32%RW UNI
"Soft" Filled Hole Tension (FHT2) Strength normalized
CTD CTD B-estimate (LVM) CTD B-estimate (Mod CV)
RTD RTD B-estimate (LVM) RTD B-estimate (Mod CV)
ETW2 ETW2 B-estimate (LVM) ETW2 B-estimate (Mod CV)
Figure 5-15: Batch plot for FHT2 Strength normalized
Env CTD RTD ETW2 CTD RTD ETW2
Me an 44.88 42.28 35.87 44.55 41.99 35.38
Stdev 0.431.060.210.351.360.38
CV 0.96 2.52 0.59 0.79 3.25 1.08
Modified CV8.008.008.008.008.008.00
Min 44.13 40.64 35.60 43.91 40.36 34.73
Max 45.27 43.53 36.09 44.98 44.07 35.79
No. Batches111111
No. Spec.666666
B-estim ate 39.16 37.49 32.58 38.29 37.11 32.68
Method LVMLVMLVMLVMLVMLVM
B-estim ate 37.23 35.01 29.68 36.95 34.78 29.27
Method LVMLVMLVMLVMLVMLVM
Laminate Filled-Hole Tension (FHT2) Strength (ksi)
Normalized As Measured
Modified CV Basis Values and/or Estimates
Basis Values and/or Estimates
Table 5-21: Statistics and Basis Values for FHT2 Strength data
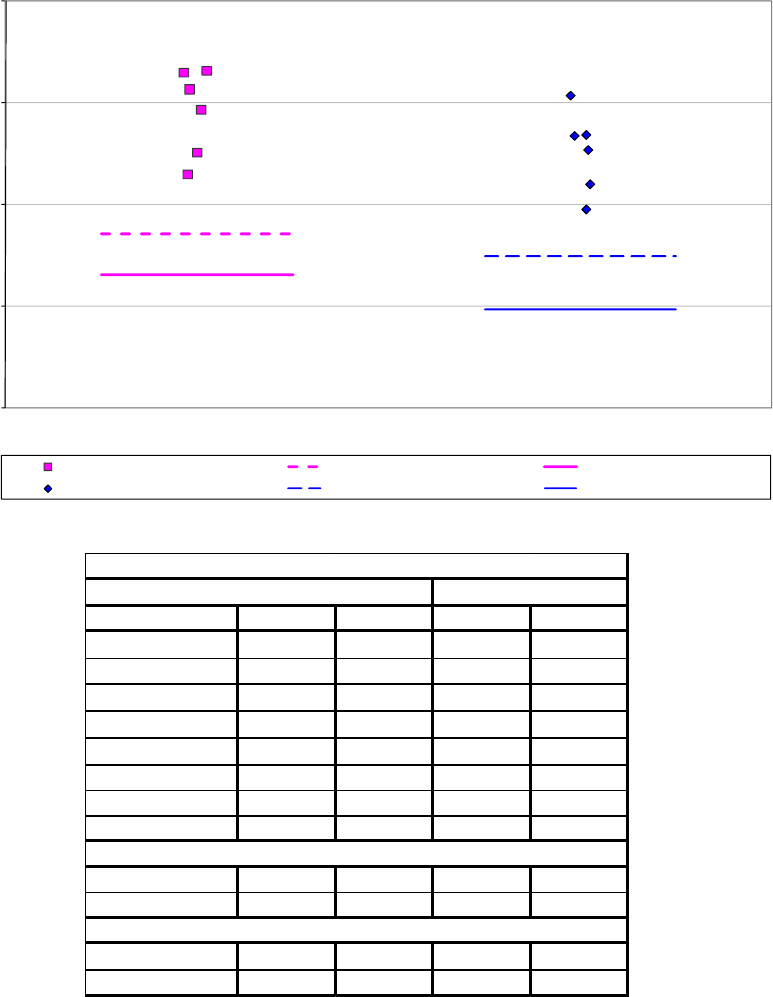
October 20, 2023 NCP-RP-2008-004 Rev B
Page 85 of 104
5.6.3 “Hard” Filled Hole Tension (FHT3)
This property had data from only one batch available, thus all basis values are estimates.
Statistics and B-estimates are given for the strength data in Table 5-22. The normalized strength
data and B-estimates are shown graphically in Figure 5-16.
65
75
85
95
105
ksi
CTD RTD
Environmental Conditions
ACG MTM45-1/AS4-145-32%RW UNI
"Hard" Filled Hole Tension (FHT3) Strength normalized
CTD CTD B-estimate (LVM) CTD B-estimate (Mod CV)
RTD RTD B-estimate (LVM) RTD B-estimate (Mod CV)
Figure 5-16: Batch plot for FHT3 Strength normalized
Env CTD RTD CTD RTD
Me an 94.15 90.20 92.65 88.99
Stdev 4.24 3.95 3.51 4.26
CV 4.50 4.38 3.79 4.79
Modified CV 8.00 8.00 8.00 8.00
Min 87.98 84.53 87.77 83.14
Max 98.17 95.71 97.49 95.80
No . Bat ch e s 1 1 1 1
No. Sp e c. 6 6 6 6
B-estim ate 82.15 79.98 79.65 78.65
Method LVM LVM LVM LVM
B-estim ate 78.09 74.70 76.85 73.70
Method LVM LVM LVM LVM
Modified CV Basis Values and/or Estimates
Laminate Filled-Hole Tension (FHT3) Strength (ksi)
Normalized As Measured
Basis Values and/or Estimates
Table 5-22: Statistics and Basis Values for FHT3 Strength data
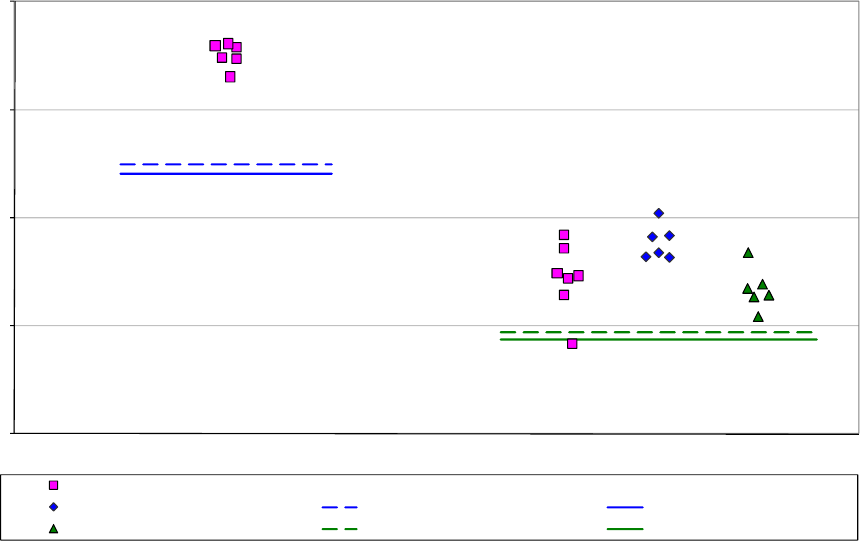
October 20, 2023 NCP-RP-2008-004 Rev B
Page 86 of 104
5.7 Filled Hole Compression Properties
5.7.1 Quasi Isotropic Filled Hole Compression (FHC1)
The as measured ETW2 data did not pass the ADK test and requires the ANOVA method to
compute basis values, but with data from only three batches, these values are considered
estimates and may result in overly conservative basis values. The as measured ETW2 data also
fails the normality test, so modified CV basis values cannot be provided. The RTD environment
had data from only one batch available. Only estimates are provided for that environmental
condition.
There were no outliers. Statistic, basis values and estimates are given for the strength data in
Table 5-23. The normalized strength data, B-basis values and B-estimates are shown graphically
in Figure 5-17.
30
40
50
60
70
ksi
RTD ETW2
Environmental Conditions
ACG MTM45-1/AS4-145-32%RW UNI
Quasi Isotropic Filled Hole Compression (FHC1) Strength normalized
Batch 1
Batch 2 RTD B-estimate (LVM) RTD B-estimate (Mod CV)
Batch 3 ETW2 B-basis (Normal) ETW2 B-basis (Mod CV)
Figure 5-17: Batch plot for FHC1 Strength normalized

October 20, 2023 NCP-RP-2008-004 Rev B
Page 87 of 104
En v RT D ET W2 RT D ET W2
Me an 65.06 45.13 64.14 46.70
Stdev 1.142.961.035.26
CV 1.75 6.56 1.61 11.27
Modified CV 8.00 7.28 8.00 11.27
Min 63.06 38.33 62.40 37.58
Max 66.11 50.39 65.18 58.12
No. Bat ch e s 1 3 1 3
No. Spec. 619619
B-basis Value 39.36
B-e stim ate 54.94 57.34 17.20
A-e stim ate NA 35.26 NA 0.00
Method LVM Normal LVM ANOVA
B-basis Value 38.72
B-e stim ate 54.07 53.31 NA
A-e stim ate NA 34.18 NA NA
Method LVM Normal LVM NA
Laminate Filled-Hole Compression (FHC1) Strength (ksi)
Normalized As Measured
Basis Values and/or Estimates
Modified CV Basis Values and/or Estimates
Table 5-23: Statistics and Basis Values for FHC1 Strength data
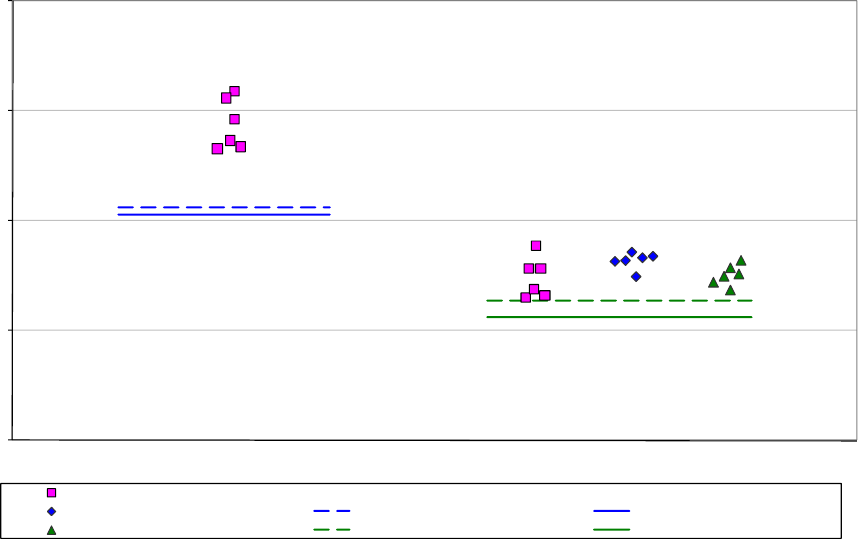
October 20, 2023 NCP-RP-2008-004 Rev B
Page 88 of 104
5.7.2 “Soft” Filled Hole Compression (FHC2)
The data for the ETW2 environment meets all requirements of CMH-17-1G. The as measured
ETW2 data did not fit a normal distribution, so modified CV basis values are not provided for
that condition. The RTD data is insufficient to generate basis values that meet the requirements
of CMH-17-1G so only estimates are provided for that condition.
There was one outlier on the low side of batch two in the as measured ETW2 dataset. It was an
outlier only for batch two, not the ETW2 condition. It was retained for this analysis.
Statistics, basis values and estimates are given for the strength data in Table 5-24. The
normalized strength data and B-basis values and B-estimates are shown graphically in Figure
5-18.
20
30
40
50
60
ksi
RTD ETW2
Environmental Conditions
ACG MTM45-1/AS4-145-32%RW UNI
"Soft" Filled Hole Compression (FHC2) Strength normalized
Batch 1
Batch 2 RTD B-estimate (LVM) RTD B-estimate (Mod CV)
Batch 3 ETW2 B-basis ETW2 B-basis (Mod CV)
Figure 5-18: Batch plot for FHC2 Strength normalized

October 20, 2023 NCP-RP-2008-004 Rev B
Page 89 of 104
En v RT D ET W2 RT D ET W2
Me an 48.80 35.42 48.10 35.60
Stdev 2.291.372.281.55
CV 4.69 3.86 4.73 4.36
Modified CV8.006.008.006.18
Min 46.55 33.04 45.97 32.41
Max 51.79 37.71 51.11 37.79
No. Bat ch e s 1 3 1 3
No. Spec. 618618
B-basis Value 32.72 32.38
B-e stim ate 41.21 43.00
A-e stim ate NA 30.81 NA 29.03
Method LVM Normal LVM Weibull
B-basis Value 31.22 NA
B-e stim ate 40.55 39.98
A-e stim ate NA 28.26 NA NA
Method LVM Normal LVM NA
Normalized As Measured
Modified CV Basis Values and/or Estimates
Basis Values and/or Estimates
Laminate Filled-Hole Compression (FHC2) Strength (ksi)
Table 5-24: Statistics and Basis Values for FHC2 Strength data
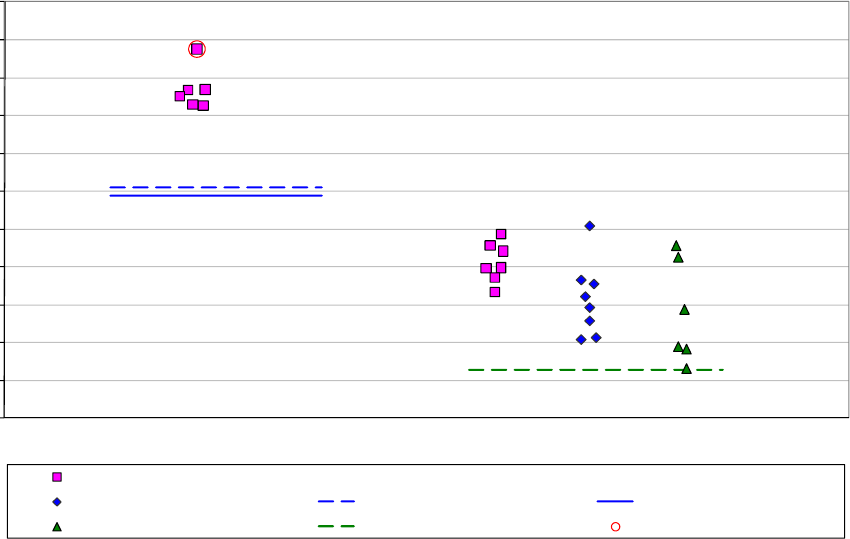
October 20, 2023 NCP-RP-2008-004 Rev B
Page 90 of 104
5.7.3 “Hard” Filled Hole Compression (FHC3)
The data for the ETW2 environments meets all requirements of CMH-17-1G. There is no
change in basis values with the modified CV approach for the ETW2 environment due to the
large CV of the measured data. The RTD environment had data from only one batch available.
Only estimates are provided for that environmental condition.
There were two outliers in the FHC3 data. One outlier was the highest value in the RTD data.
Since there was only one batch of data for the RTD condition, it can only be stated that it was an
outlier for that batch. The other outlier was on the high side of batch two in the ETW2 dataset.
It was an outlier only for the as measured data and only for batch two, not for the ETW2
condition. Both outliers were retained for this analysis.
Statistics, basis values and estimates are given for the strength data in Table 5-25. The
normalized strength data, B-basis values and B-estimates are shown graphically in Figure 5-19.
40
45
50
55
60
65
70
75
80
85
90
95
ksi
RTD ETW2
Environmental Conditions
ACG MTM45-1/AS4-145-32%RW UNI
"Hard" Filled Hole Compression (FHC3) Strength normalized
Batch 1
Batch 2 RTD B-estimate (LVM) RTD B-estimate (Mod CV)
Batch 3 ETW2 B-basis (Normal) Outlier
Figure 5-19: Batch plot for FHC3 Strength normalized

October 20, 2023 NCP-RP-2008-004 Rev B
Page 91 of 104
En v RT D ET W2 RT D ET W2
Me an 83.49 56.83 81.58 56.57
Stdev 2.74 5.47 3.34 5.01
CV 3.28 9.62 4.09 8.86
Modified CV 8.00 9.62 8.00 8.86
Min 81.35 46.60 78.41 48.20
Max 88.76 65.34 87.90 64.21
No . Bat ch e s 1 3 1 3
No. Sp e c. 6 21 6 21
B-basis Value 46.41 47.02
B-e stim ate 70.50 72.93
A-e stim ate NA 38.99 NA 40.21
Method LVM Normal LVM Normal
B-basis Value NA NA
B-e stim ate 69.38 67.80
A-e s t im at e NA NA NA NA
Method LVM NA LVM NA
Modified CV Basis Values and/or Estimates
Laminate Filled-Hole Compression (FHC3) Strength (ksi)
Normalized As Measured
Basis Values and/or Estimates
Table 5-25: Statistics and Basis Values for FHC3 Strength data
October 20, 2023 NCP-RP-2008-004 Rev B
Page 92 of 104
5.8 Pin Bearing Properties
5.8.1 Quasi Isotropic Pin Bearing (PB1)
Pooling the two environments was not acceptable for the 2% offset strength because the pooled
dataset, for both the normalized and as measured data, failed the Anderson-Darling test for
normality. Modified CV basis values are not available for the RTD condition due to the large
CV of that data.
Pooling the two environments was acceptable for the as measured ultimate strength data, but the
normalized RTD data failed the ADK test and could not be pooled. The RTD data required the
ANOVA method to compute basis values, but with data from only three batches, these values are
considered estimates and may result in overly conservative basis values. The normalized RTD
data did pass the ADK test with the modified CV transform, so modified CV values are provided
and pooling was appropriate for the modified CV basis values.
There was one outlier. It was in the as measured 2% offset strength data. It was on the low side
of batch one in the as measured RTD dataset. It was an outlier for the RTD condition but not for
batch one. It was retained for this analysis.
Statistics, basis values and estimates are given for the 2% offset strength data in Table 5-26 and
the ultimate strength data in Table 5-27. The normalized data, B-basis values and B-estimates
are shown graphically in Figure 5-20 for the 2% offset strength data and in Figure 5-21 for the
ultimate strength data.
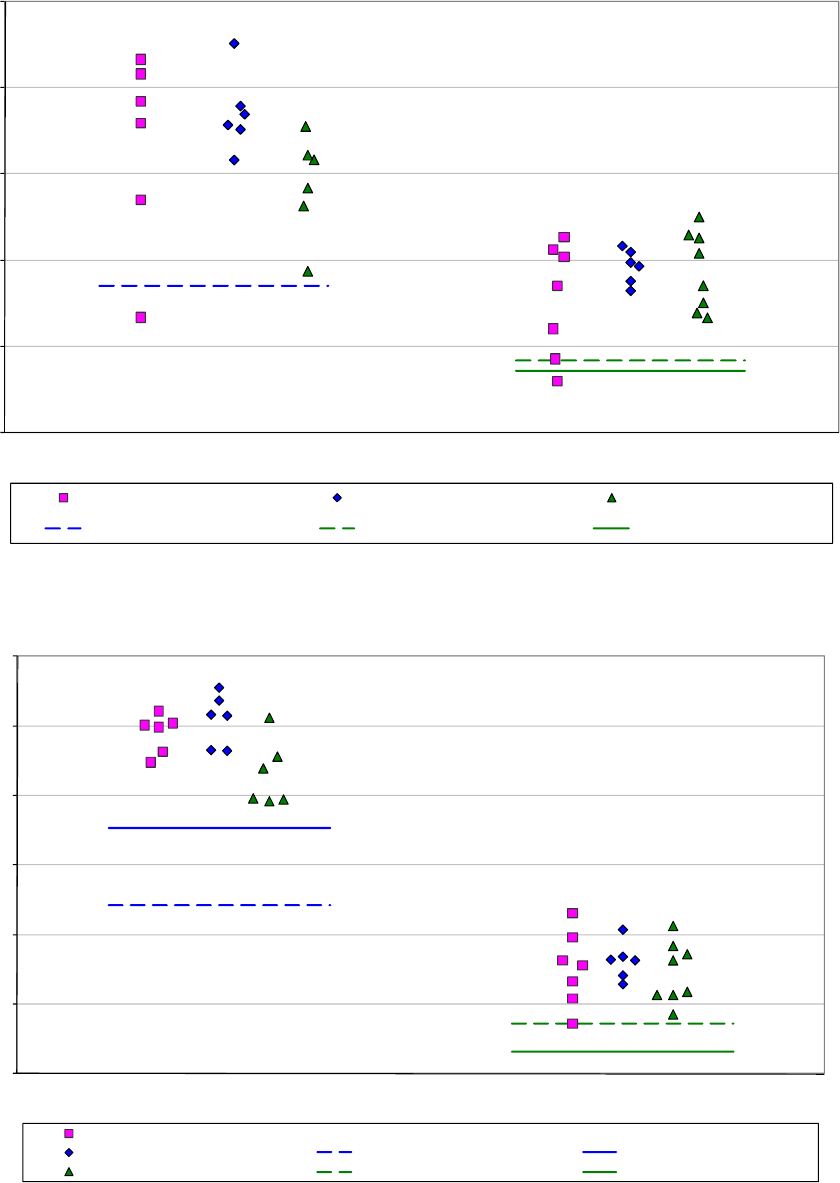
October 20, 2023 NCP-RP-2008-004 Rev B
Page 93 of 104
60
70
80
90
100
110
ksi
RTD ETW2
Environmental Conditions
ACG MTM45-1/AS4-145-32%RW UNI
Quasi Isotropic Pin Bearing (PB1) 2% Offset Strength normalized
Batch 1 Batch 2 Batch 3
RTD B-basis (Normal) ETW2 B-basis (Normal) ETW2 B-basis (Mod CV)
Figure 5-20: Batch plot for PB1 2% Offset Strength normalized
80
90
100
110
120
130
140
ksi
RTD ETW2
Environmental Conditions
ACG MTM45-1/AS4-145-32%RW UNI
Quasi Isotropic Pin Bearing (PB1) Ultimate Strength normalized
Batch 1
Batch 2 RTD B-estimate (ANOVA) RTD B-basis (Mod CV)
Batch 3 ETW2 B-basis (Normal) ETW2 B-basis (Mod CV)
Figure 5-21: Batch plot for PB1 Ultimate Strength normalized

October 20, 2023 NCP-RP-2008-004 Rev B
Page 94 of 104
En v RT D ET W2 RT D ET W2
Me an 93.03 77.77 93.03 77.43
Stdev 8.144.957.665.26
CV 8.75 6.36 8.23 6.80
Modified CV8.757.188.237.40
Min 73.31 65.88 71.79 64.16
Max 105.16 84.95 103.79 86.23
No. Bat ch e s 3 3 3 3
No. Spec. 18211821
B-basis Value 76.95 68.34 78.18 67.41
A-e stim ate 65.56 61.62 64.07 60.26
Method Normal Normal We ibull Norm al
B-basis Value NA 67.13 NA 66.52
A-e stim ate NA 59.55 NA 58.74
Method NA normal NA normal
Basis Values and/or Estimates
Pin Bearing Properties (PB1) 2% Offset Strength (ksi)
Normalized As Measured
Modified CV Basis Values and/or Estimates
Table 5-26: Statistics and Basis Values for PB1 2% Offset Strength data
En v RT D ET W2 RT D ET W2
Me an 127.63 95.19 127.67 94.75
Stdev 4.934.204.414.02
CV 3.86 4.41 3.46 4.25
Modified CV6.006.216.006.12
Min 119.16 87.19 122.20 86.10
Max 135.46 103.12 136.34 102.00
No. Bat ch e s 3 3 3 3
No. Spec. 18211821
B-basis Value 87.20 120.06 87.24
B-es timate 104.16
A-e stim ate 87.43 81.49 114.90 82.06
Method ANOVA Normal pooled pooled
B-basis Value 115.39 83.12 115.51 82.76
A-e stim ate 107.10 74.79 107.27 74.48
Method pooled pooled pooled pooled
Modified CV Basis Values and/or Estimates
Pin Bearing (PB1) Ultimate Strength (ksi)
Normalized As Measured
Basis Values and/or Estimates
Table 5-27: Statistics and Basis Values for PB1 Ultimate Strength data
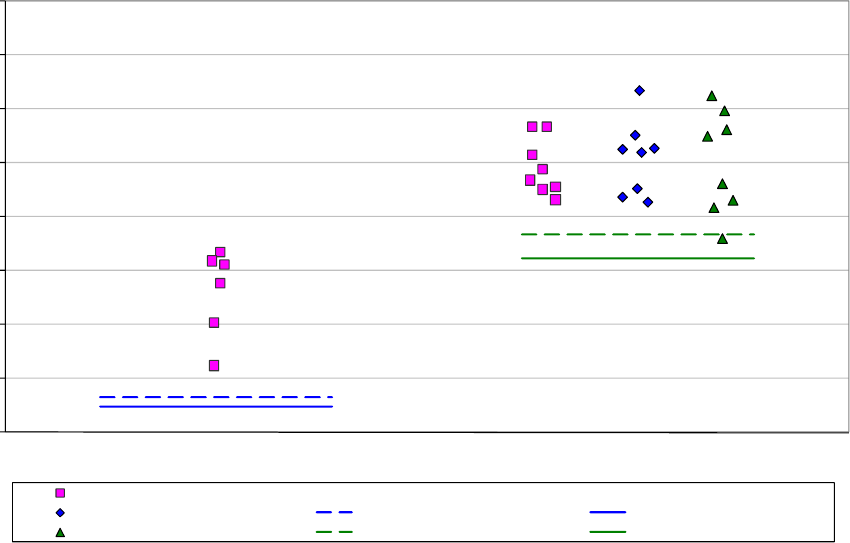
October 20, 2023 NCP-RP-2008-004 Rev B
Page 95 of 104
5.8.2 “Soft” Pin Bearing (PB2)
The ETW2 data meets all requirements of CMH-17-1G. The RTD data is insufficient to
generate basis values that meet the requirements of CMH-17-1G so only estimates are provided
for that condition.
There were no outliers. Statistics, basis values and estimates are given for the 2% offset strength
data in Table 5-28 and the ultimate strength data in Table 5-29. The normalized data, B-basis
values and B-estimates are shown graphically in Figure 5-22 for the 2% offset strength and
Figure 5-23 for the ultimate strength data.
50
55
60
65
70
75
80
85
90
ksi
RTD ETW2
Environmental Conditions
ACG MTM45-1/AS4-145-32%RW UNI
"Soft" Pin Bearing (PB2) 2% Offset Strength normalized
Batch 1
Batch 2 RTD B-estimate (LVM) RTD B-estimate (Mod CV)
Batch 3 ETW2 B-basis (Normal) ETW2 B-basis (Mod CV)
Figure 5-22: Batch plot for PB2 2% Offset Strength normalized
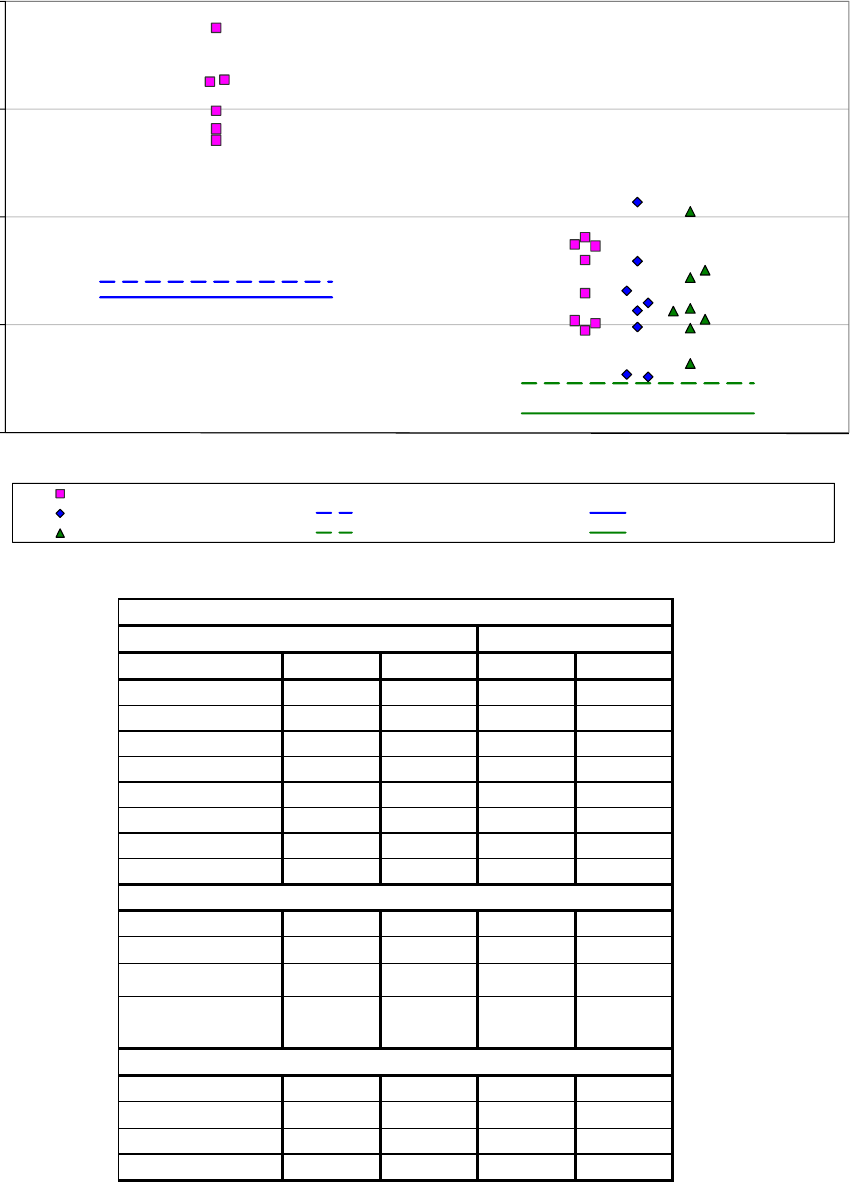
October 20, 2023 NCP-RP-2008-004 Rev B
Page 96 of 104
80
90
100
110
120
ksi
RTD ETW2
Environmental Conditions
ACG MTM45-1/AS4-145-32%RW UNI
"Soft" Pin Bearing (PB2) Ultimate Strength normalized
Batch 1
Batch 2 RTD B-estimate (LVM) RTD B-estimate (Mod CV)
Batch 3 ETW2 B-basis (Normal) ETW2 B-basis (Mod CV)
Figure 5-23: Batch plot for PB2 Ultimate Strength normalized
En v RT D ET W2 RT D ET W2
Me an 63.08 75.04 62.68 75.71
Stdev 4.103.574.254.44
CV 6.49 4.76 6.79 5.86
Modified CV8.006.388.006.93
Min 56.19 67.97 55.41 69.93
Max 66.75 81.67 66.41 85.06
No. Bat ch e s 1 3 1 3
No. Spec. 624624
B-basis Value 68.43 67.49
B-e stim ate 53.27 53.70
A-e stim ate NA 63.68 NA 61.60
Method LVM Normal LVM Normal
B-basis Value 66.17 65.99
B-e stim ate 52.42 52.09
A-e stim ate NA 59.81 NA 59.02
Method LVM Normal LVM Normal
Pin Bearing Properties (PB2) 2% Offset Strength (ksi)
Normalized As Measured
Basis Values and/or Estimates
Modified CV Basis Values and/or Estimates
Table 5-28: Statistics and Basis Values for PB2 2% Offset Strength data

October 20, 2023 NCP-RP-2008-004 Rev B
Page 97 of 104
En v RT D ET W2 RT D ET W2
Me an 111.37 92.78 110.65 93.57
Stdev 3.804.383.964.88
CV 3.41 4.72 3.58 5.22
Modified CV8.006.368.006.61
Min 107.16 85.23 106.62 83.76
Max 117.60 101.46 116.98 105.67
No. Bat ch e s 1 3 1 3
No. Spec. 624624
B-basis Value 84.66 84.53
B-e stim ate 94.04 98.91
A-e stim ate NA 78.85 NA 78.05
Method LVM Normal LVM Normal
B-basis Value 81.84 82.11
B-e stim ate 92.55 91.95
A-e stim ate NA 74.00 NA 73.90
Method LVM Normal LVM Normal
Modified CV Basis Values and/or Estimates
Normalized As Measured
Basis Values and/or Estimates
Pin Bearing Properties (PB2) Ultimate Strength (ksi)
Table 5-29: Statistics and Basis Values for PB2 Ultimate Strength data
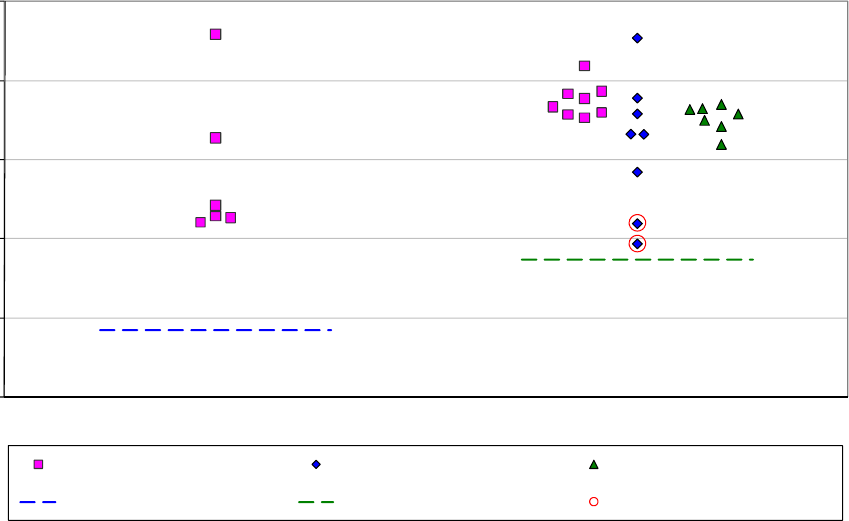
October 20, 2023 NCP-RP-2008-004 Rev B
Page 98 of 104
5.8.3 “Hard” Pin Bearing (PB3)
The ETW2 data meets all requirements of CMH-17-1G. The RTD data is insufficient to generate
basis values that meet the requirements of CMH-17-1G so only estimates are provided for that
condition. Modified CV basis values are not available for the 2% offset strength. The data from
the RTD condition has a large CV and the modified CV method would not make any change to
it, while the data from the ETW2 condition fails the normality test.
There were three outliers, two in the 2% offset strength data and one in the ultimate strength
data. The outliers in the 2% offset strength data were both on the low side of batch two in the
normalized ETW2 dataset. In the ultimate strength data, the outlier was on the high side of batch
three in the as measured ETW2 dataset. All three outliers were outliers for the ETW2 condition,
not for their respective batches. All outliers were retained for this analysis.
Statistics, basis values and estimates are given for the 2% offset strength data in Table 5-30 and
the ultimate strength data in Table 5-31. The normalized data, B-basis values and B-estimates
are shown graphically in Figure 5-24 for the 2% offset strength data and in Figure 5-25 for the
ultimate strength data.
40
50
60
70
80
90
ksi
RTD ETW2
Environmental Conditions
ACG MTM45-1/AS4-145-32%RW UNI
"HARD" Pin Bearing (PB3) 2% Offset Strength normalized
Batch 1 Batch 2 Batch 3
RTD B-estimate (LVM) ETW2 B-basis (Non Parametric) Outliers
Figure 5-24: Batch plot for PB3 2% Offset Strength normalized
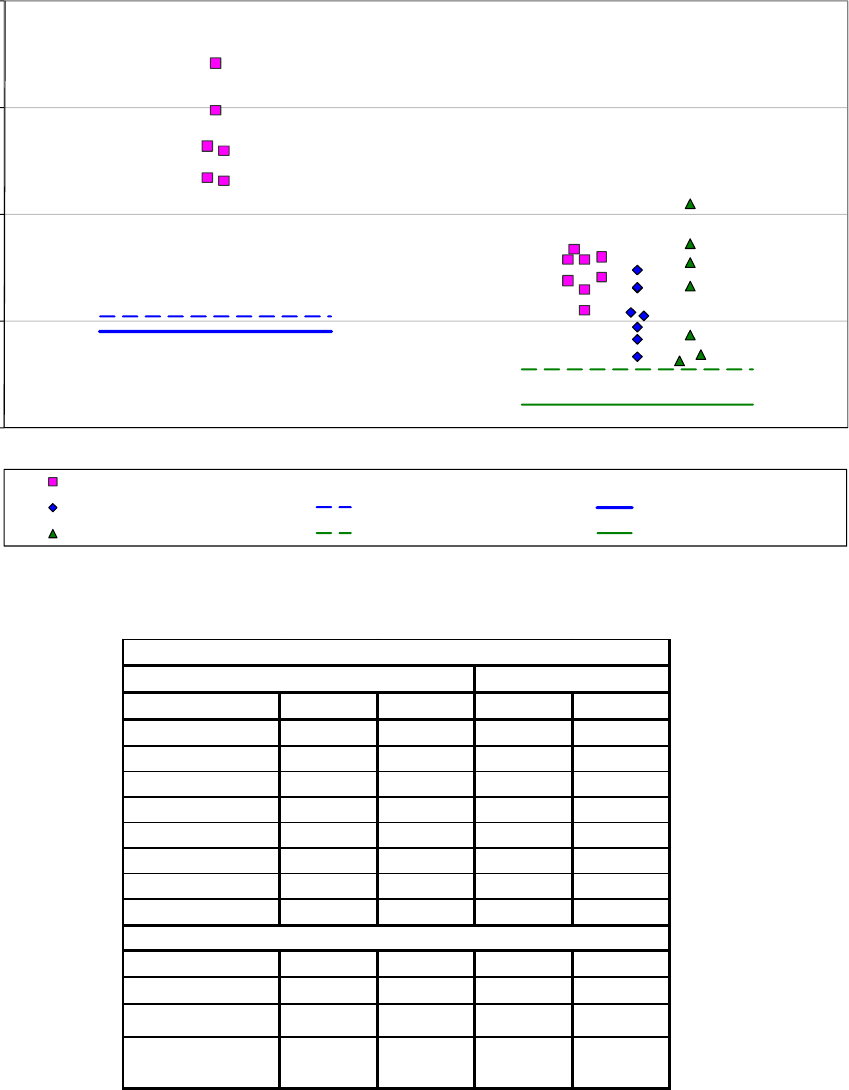
October 20, 2023 NCP-RP-2008-004 Rev B
Page 99 of 104
80
90
100
110
120
ksi
RTD ETW2
Environmental Conditions
ACG MTM45-1/AS4-145-32%RW UNI
"HARD" Pin Bearing (PB3) Ultimate Strength normalized
Batch 1
Batch 2 RTD B-estimate (LVM) RTD B-estimate (Mod CV)
Batch 3 ETW2 B-basis (Normal) ETW2 B-basis (Mod CV)
Figure 5-25: Batch plot for PB3 Ultimate Strength normalized
En v RT D ET W2 RT D ET W2
Mean 68.40 74.88 67.88 75.42
Stdev 9.455.569.384.86
CV 13.81 7.43 13.82 6.45
Modified CV 13.81 7.71 13.82 7.22
Min 62.03 59.39 61.07 62.12
Max 85.88 85.37 85.22 84.76
No. Batche s 1 3 1 3
No . Sp e c. 6 23 6 23
B-basis Value 57.35 64.64
B-es tim ate 48.45 48.06
A-e stim ate NA 38.23 NA 54.19
Method LVM
No n -
Par am e tric
LVM Weibull
Pin Bearing Properties (PB3) 2% Offset Strength (ksi)
Normalized As Measured
Basis Values and/or Estimates
Table 5-30: Statistics and Basis Values for PB3 2% Offset Strength data

October 20, 2023 NCP-RP-2008-004 Rev B
Page 100 of 104
En v RT D ET W2 RT D ET W2
Mean 107.16 92.69 106.34 93.42
Stdev 4.193.834.123.87
CV 3.91 4.13 3.87 4.14
Modified CV 8.00 6.06 8.00 6.07
Min 103.16 86.28 102.64 87.99
Max 114.18 101.02 113.30 104.42
No. Batche s 1 3 1 3
No . Sp e c. 6 23 6 23
B-basis Value 85.54 86.20
B-es tim ate 90.49 95.07
A-e stim ate NA 80.42 NA 81.03
Method LVM Normal LVM Normal
B-basis Value 82.18 82.82
B-es tim ate 89.06 88.38
A-e stim ate NA 74.67 NA 75.24
Method LVM Normal LVM Normal
Pin Bearing Properties (PB3) Ultimate Strength (ksi)
Normalized As Measured
Basis Values and/or Estimates
Modified CV Basis Values and/or Estimates
Table 5-31: Statistics and Basis Values for PB3 Ultimate Strength data
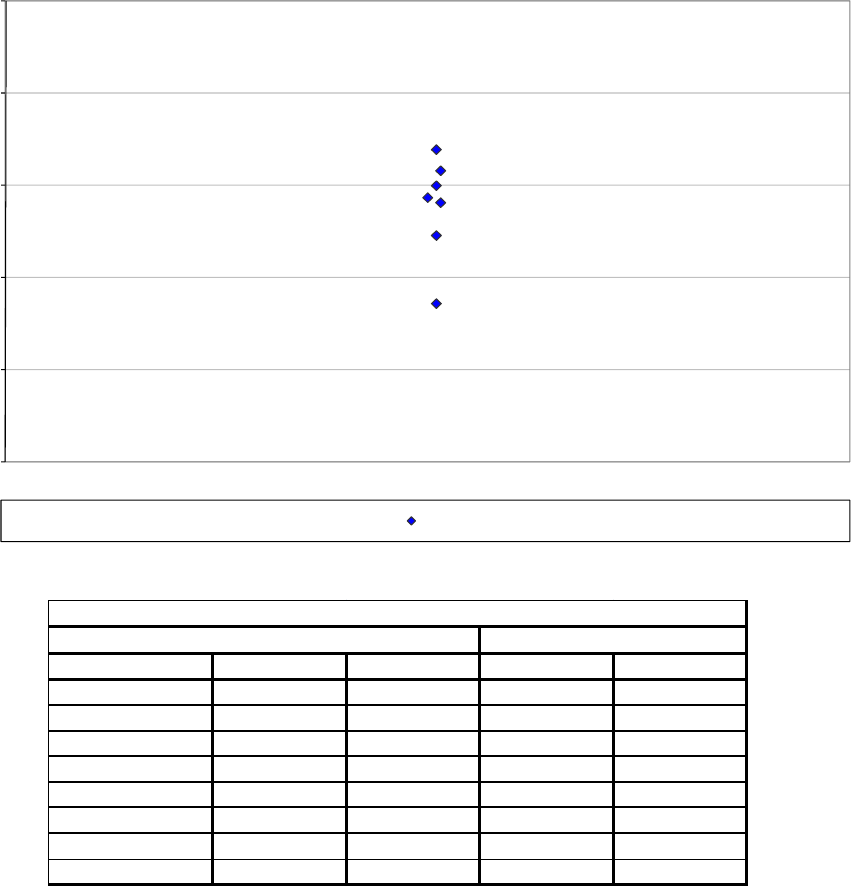
October 20, 2023 NCP-RP-2008-004 Rev B
Page 101 of 104
5.9 Compression After Impact Properties (CAI)
Basis values are not computed for this property. However the summary statistics are presented in
Table 5-32. The normalized strength data are shown graphically in Figure 5-26.
20
24
28
32
36
40
ksi
Environmental Condition: RTD
ACG MTM45-1/AS4-145-32%RW UNI
Compression After Impact (CAI) Strength normalized
RTD
Figure 5-26: Batch plot for CAI Strength normalized
RTD Env. Normalized As measured Normalized As measured
Mean 31.09 30.25 7.01 6.82
Stdev 2.182.190.030.04
CV 7.02 7.25 0.42 0.58
Modified CV7.517.636.006.00
Min 26.90 26.11 6.97 6.77
Max 33.55 32.81 7.05 6.88
No. Bat ch e s 1 1 1 1
No. Sp e c. 7 7 7 7
Strength (ksi) Modulus (msi)
Compression After Impact (CAI)
Table 5-32: Statistics and Basis Values for CAI data
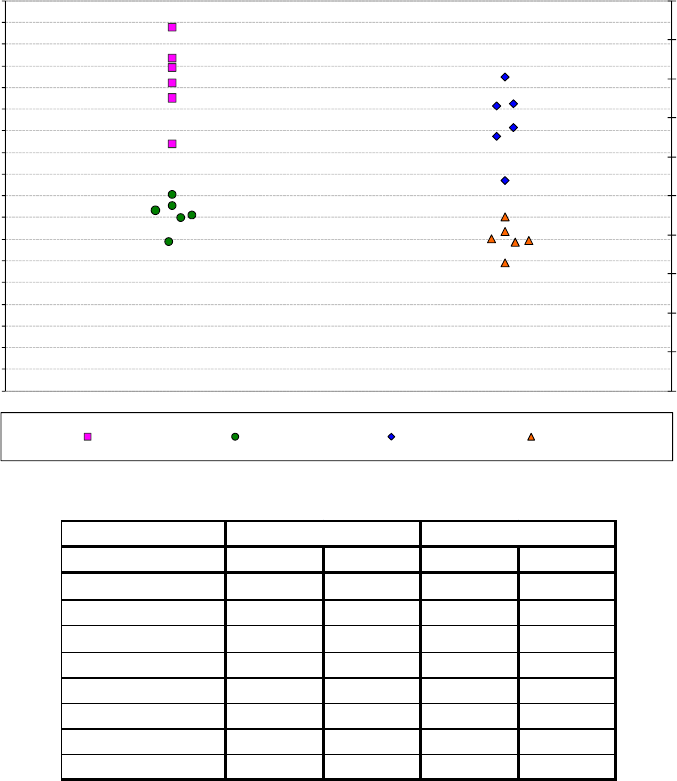
October 20, 2023 NCP-RP-2008-004 Rev B
Page 102 of 104
5.10 Interlaminar Tension (ILT) and Curved Beam Strength (CBS)
The Interlaminar Tension and Curved Beam Strength data is not normalized. Basis values are
not computed for the ILT and CBS data. Test results only are presented here. Statistics are
given for the Interlaminar Tension (ILT) and Curved Beam strength (CBS) data in Table 5-33.
ILT tests were performed at both RTD and ETW2 environmental conditions.
0
1
2
3
4
5
6
7
8
9
10
0
20
40
60
80
100
120
140
160
180
200
220
240
260
280
300
320
340
360
ILT (ksi)
CBS (lb)
CBS ILT
ACG MTM45-1/AS4-145-32%RW UNI
Curved Beam Strength (CBS) and Interlaminar Tension (ILT) as measured
CBS RTD CBS ETW2 ILT RTD ILT ETW2
Figure 5-27: Plot for ILT and CBS Data as measured
Property
En v RT D ET W2 RT D ET W2
Me an 6.89 3.90 287.34 163.19
Stdev 0.91 0.39 36.59 14.48
CV 13.19 9.90 12.74 8.87
Mod CV 13.19 9.90 12.74 8.87
Min 5.39 3.28 227.96 137.84
Max 8.04 4.46 335.80 181.14
No. Bat ch e s 1 1 1 1
No. Sp e c. 6 6 6 6
ILT (ksi) CBS (lb)
Table 5-33: Statistics for ILT and CBS data

October 20, 2023 NCP-RP-2008-004 Rev B
Page 103 of 104
6. Outliers
Outliers were identified according to the standards documented in section 2.1.5, which are in
accordance with the guidelines developed in CMH-17-1G section 8.3.3. An outlier may be an
outlier in the normalized data, the as measured data, or both. A specimen may be an outlier for
the batch only (before pooling the three batches within a condition together) or for the condition
(after pooling the three batches within a condition together) or both.
Approximately 5 out of 100 specimens will be identified as outliers due to the expected random
variation of the data. This test is used only to identify specimens to be investigated for a cause of
the extreme observation. Outliers that have an identifiable cause are removed from the dataset as
they inject bias into the computation of statistics and basis values. Specimens that are outliers for
the condition and in both the normalized and as measured data are typically more extreme and
more likely to have a specific cause and be removed from the dataset than other outliers.
Specimens that are outliers only for the batch, but not the condition and specimens that are
identified as outliers only for the normalized data or the as measured data but not both, are
typical of normal random variation.
All outliers identified were investigated to determine if a cause could be found. Outliers with
causes were removed from the dataset and the remaining specimens were analyzed for this
report. Information about specimens that were removed from the dataset along with the cause for
removal is documented in the “MTM45-1 AS4 Data MH Cure Cycle.pdf”.
Outliers for which no causes could be identified are listed in Table 6-1. These outliers were
included in the analysis for their respective test properties.
Test Condition Batch Specimen Number
Normalized
Strength
As-Measured
Strength
High/
Low
Batch
Outlier
Condition
Outlier
LT 228.30 226.92 No
UNT0 120.23 118.71 Norm only
LT 264.69
UNT0 141.54
LT 214.72 224.77
UNT0 120.43 120.20
LT 243.03
UNT0 117.94
LC 168.65 167.89
UNC0 94.27 93.45
TC RTD 1 AITR1392-ASU1-TC-A-MH1-RTD-1 NA 23.89 Low Yes No
IPS 0.2% Offset ETD 2 AITR1392-ASU1-IPS-B-MH3-1-ETD-4 NA 4.92 High Yes No
SBS RTD 2 AITR1392-ASU1-SBS-B-MH1-RTD-3 NA 12.98 High Yes No
UNT1 RTD 1 AITR1392-ASU1-UNT1-A-MH1-RTD-2 95.61 94.04 Low No Yes
OHT1 RTD 2 AITR1392-ASU1-OHT1-B-MH1-RTD-2 Not an Outlier 60.59 High YesNo
OHT1 ETW2 1 AITR1392-ASU1-OHT1-A-MH2-ETW2-1 60.05 57.90 High Yes Norm only
OHT2 CTD 1 AITR1392-ASU1-OHT2-A-MH2-CTD-1 43.02 Not an Outlier Low Yes No
FHT1 CTD 2 AITR1392-ASU1-FHT1-B-MH1-CTD-1 60.34 Not an Outlier High YesNo
FHC2 ETW2 2 AITR1392-ASU1-FHC2-B-MH2-ETW2-2 Not an Outlier 34.84 Low Yes No
FHC3 RTD 1 AITR1392-ASU1-FHC3-A-MH1-RTD-4 88.76 87.90 High Yes NA
FHC3 ETW2 2 AITR1392-ASU1-FHC3-B-MH2-ETW2-4 Not an Outlier 62.61 High Yes No
PB1 - 2% Offset RTD 1 AITR1392-ASU1-PB1-A-MH2-RTD-3 Not an Outlier 71.79 Low No Yes
PB3 - 2% Offset ETW2 2 AITR1392-ASU1-PB3-B-MH2-ETW2-2 59.39 Not an Outlier Low N o Yes
PB3 - 2% Offset ETW2 2 AITR1392-ASU1-PB3-B-MH2-ETW2-4 61.95 Not an Outlier Low N o Yes
PB3 - Ult. Str. ETW2 3 AITR1392-ASU1-PB3-C-MH2-ETW2-2 Not an Outlier 104.42 High No Yes
ETW2
No
Low No Yes
Low Yes Yes2 AITR1392-ASU1-UNT0-B-MH1-ETW2-3 Not an Outlier
Not an Outlier High Yes2 AITR1392-ASU1-UNT0-B-MH2-ETW-3
Low YesRTD
ETW
ETW
2 AITR1392-ASU1-UNT0-B-MH1-RTD-3
3 AITR1392-ASU1-UNT0-C-MH1-ETW-2
ETW 1 High No YesAITR1392-ASU1-UNC0-A-MH2-ETW-4
Table 6-1: List of outliers
October 20, 2023 NCP-RP-2008-004 Rev B
Page 104 of 104
7. References
1. Snedecor, G.W. and Cochran, W.G., Statistical Methods, 7th ed., The Iowa State
University Press, 1980, pp. 252-253.
2.
Stefansky, W., "Rejecting Outliers in Factorial Designs," Technometrics, Vol. 14,
1972, pp. 469-479.
3.
Scholz, F.W. and Stephens, M.A., “K-Sample Anderson-Darling Tests of Fit,” Journal
of the American Statistical Association
, Vol. 82, 1987, pp. 918-924.
4.
Lehmann, E.L., Testing Statistical Hypotheses, John Wiley & Sons, 1959, pp. 274-
275.
5.
Levene, H., “Robust Tests for Equality of Variances,” in Contributions to Probability
and Statistics
, ed. I. Olkin, Palo, Alto, CA: Stanford University Press, 1960.
6.
Levene, H., “Robust Tests for Equality of Variances,” in Contributions to Probability
and Statistics
, ed. I. Olkin, Palo, Alto, CA: Stanford University Press, 1960.
7.
Lawless, J.F., Statistical Models and Methods for Lifetime Data, John Wiley & Sons,
1982, pp. 150, 452-460.
8.
Metallic Materials and Elements for Aerospace Vehicle Structures, MIL-HDBK-5E,
Naval Publications and Forms Center, Philadelphia, Pennsylvania, 1 June 1987, pp. 9-
166,9-167.
9.
Hanson, D.L. and Koopmans, L.H., "Tolerance Limits for the Class of Distribution
with Increasing Hazard Rates,"
Annals of Math. Stat., Vol 35, 1964, pp. 1561-1570.
10.
Vangel, M.G., “One-Sided Nonparametric Tolerance Limits,” Communications in
Statistics: Simulation and Computation
, Vol. 23, 1994, p. 1137.
11.
Vangel, M.G., "New Methods for One-Sided Tolerance Limits for a One-Way
Balanced Random Effects ANOVA Model,"
Technometrics, Vol 34, 1992, pp. 176-
185.
12.
Odeh, R.E. and Owen, D.B., Tables of Normal Tolerance Limits, Sampling Plans and
Screening
, Marcel Dekker, 1980.
13.
Tomblin, John and Seneviratne, Waruna, Laminate Statistical Allowable Generation
for Fiber-Reinforced Composites Material: Lamina Variability Method,
U.S.
Department of Transportation, Federal Aviation Administration, May 2006.
